Revolutionizing the Construction Industry Through Smart Project Management SystemsBusiness Consulting Data Analysis Revolutionizing the Construction Industry Through Smart Project Management Systems Read More »
Transforming Construction with Expert Project Management and ERP SolutionsBusiness Consulting Data Analysis Transforming Construction with Expert Project Management and ERP Solutions Read More »
Kruskal-Wallis Test Explained with Example and Use CasesData Analysis Kruskal-Wallis Test Explained with Example and Use Cases Read More »
Why Every Business Needs A Project Management Consultant Today?Business Consulting Data Analysis Why Every Business Needs A Project Management Consultant Today? Read More »
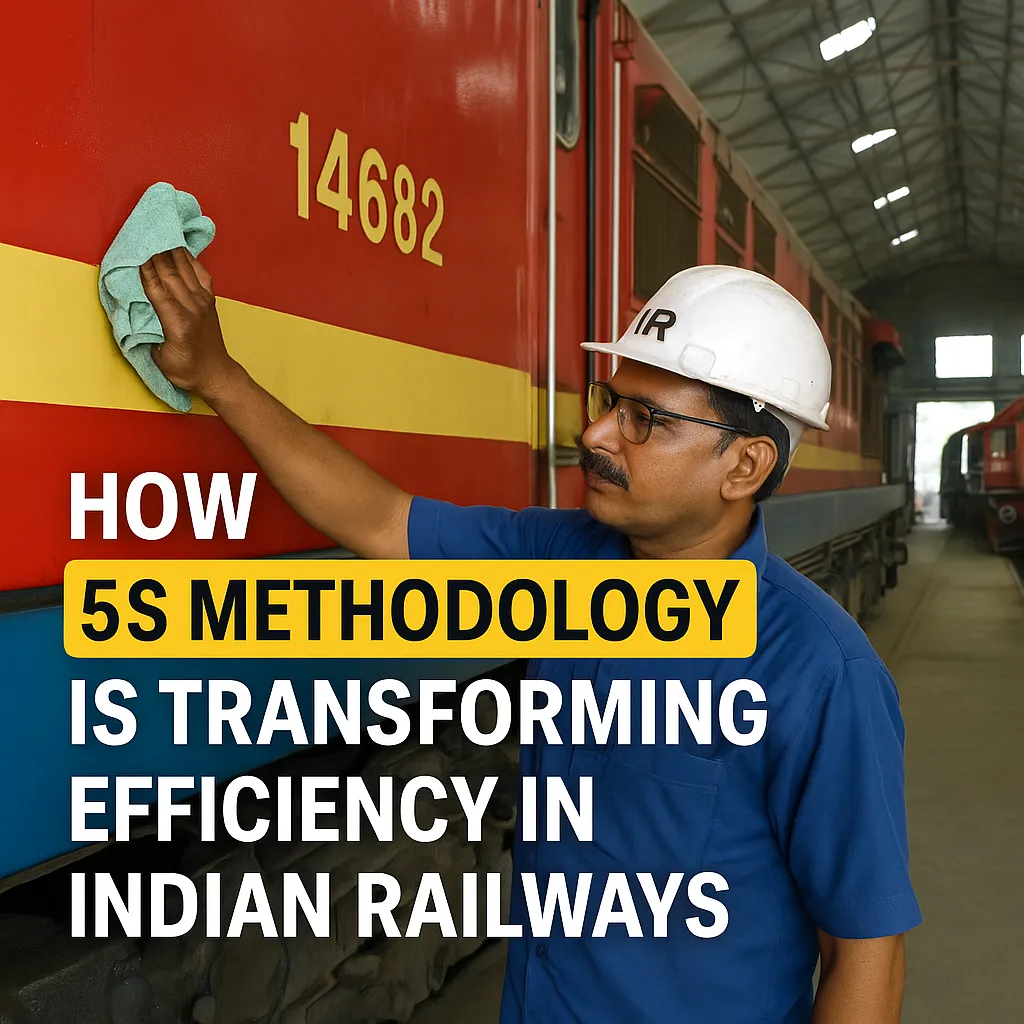
How 5S Methodology is Transforming Efficiency in Indian RailwaysData Analysis How 5S Methodology is Transforming Efficiency in Indian Railways Read More »
RideshareRevolt:Ola,Uber&RapidoDriversPushforFareHike – ACritical Review by Simbi Labs IndiaData Analysis RideshareRevolt:Ola,Uber&RapidoDriversPushforFareHike – ACritical Review by Simbi Labs India Read More »
Problem Solving Through Value Stream Mapping in Indian Railways: A Lean Approach to Operational ExcellenceData Analysis Problem Solving Through Value Stream Mapping in Indian Railways: A Lean Approach to Operational Excellence Read More »
Problem Solving Through Value Stream Mapping (VSM): A Lean Approach to Process OptimizationData Analysis Lean Six Sigma Problem Solving Through Value Stream Mapping (VSM): A Lean Approach to Process Optimization Read More »
Struggling with Your Thesis? Get Expert PhD Data Analysis Services TodayData Analysis Research & Riding Struggling with Your Thesis? Get Expert PhD Data Analysis Services Today Read More »
Best Data Analytics Services in India: Expert Solutions for Businesses and ResearchersData Analysis Statistical Data Analysis Best Data Analytics Services in India: Expert Solutions for Businesses and Researchers Read More »