
Web GIS And Interactive Mapping
Powerful Web GIS & Interactive Mapping Solutions
Simbi Labs India develops interactive web maps and customized GIS applications that make geographic data easy to visualize, explore, and share. Our solutions support spatial analysis, infrastructure planning, asset mapping, and location-based decision-making through accessible, data-driven mapping tools.
One Platform, Multiple Mapping Applications
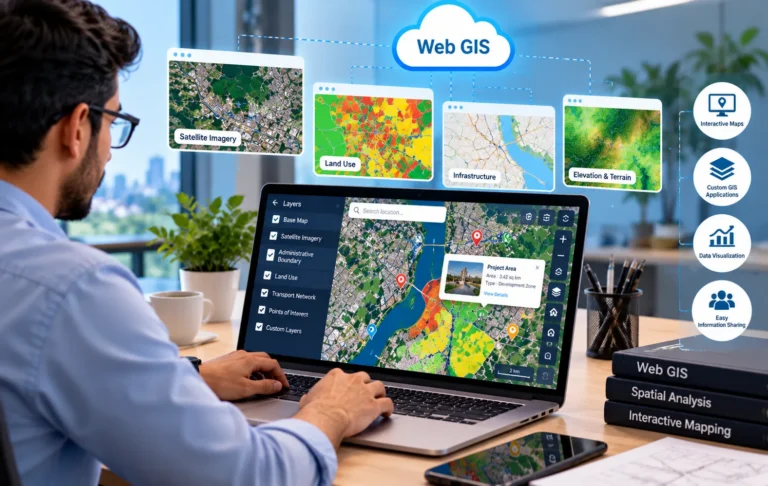
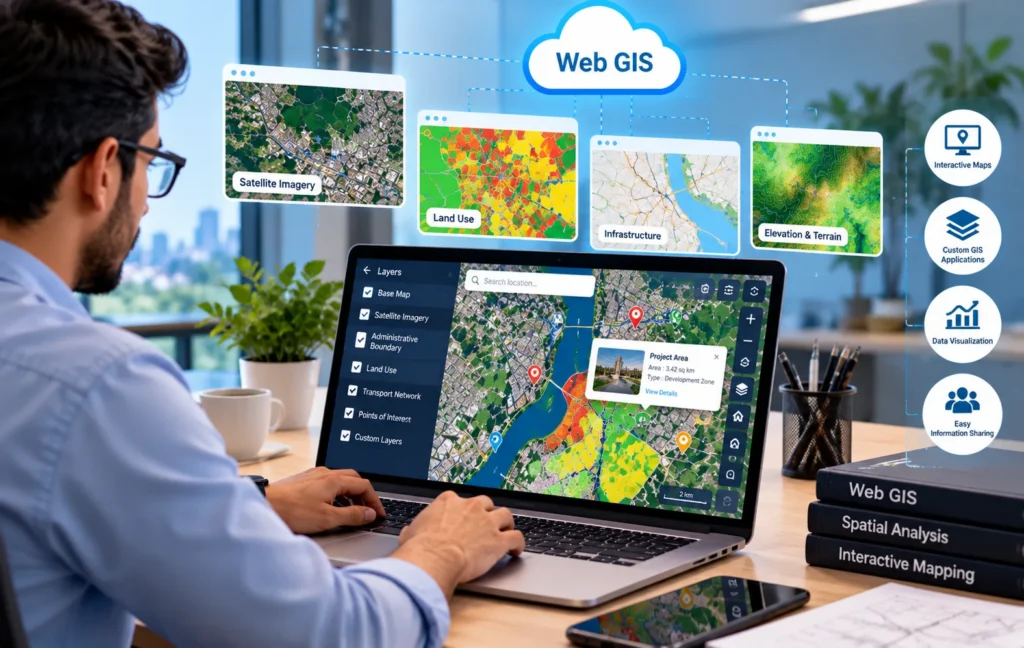
Simbi Labs India provides Web GIS and interactive mapping solutions to help organizations visualize, explore, and share geographic data. Our services combine interactive maps, spatial data integration, and web-based GIS applications to support infrastructure planning, asset management, urban development, and environmental monitoring. We transform complex spatial information into accessible map-based insights that improve collaboration, simplify analysis, and support smarter, data-driven decisions.
Interactive Web Mapping Solutions
Explore. Visualize. Understand.
Simbi Labs India develops interactive web maps that help users explore geographic data, visualize spatial patterns, and access location-based information through easy-to-use digital interfaces.
Our Services Include:
Interactive map development
Searchable location mapping
Custom map layers and controls
Geographic data visualization
Benefits:
Easy access to spatial information
Improved data exploration
Better collaboration
Smarter planning decisions
Web GIS Dashboards & Applications
Connect Data. Visualize Insights. Make Decisions.
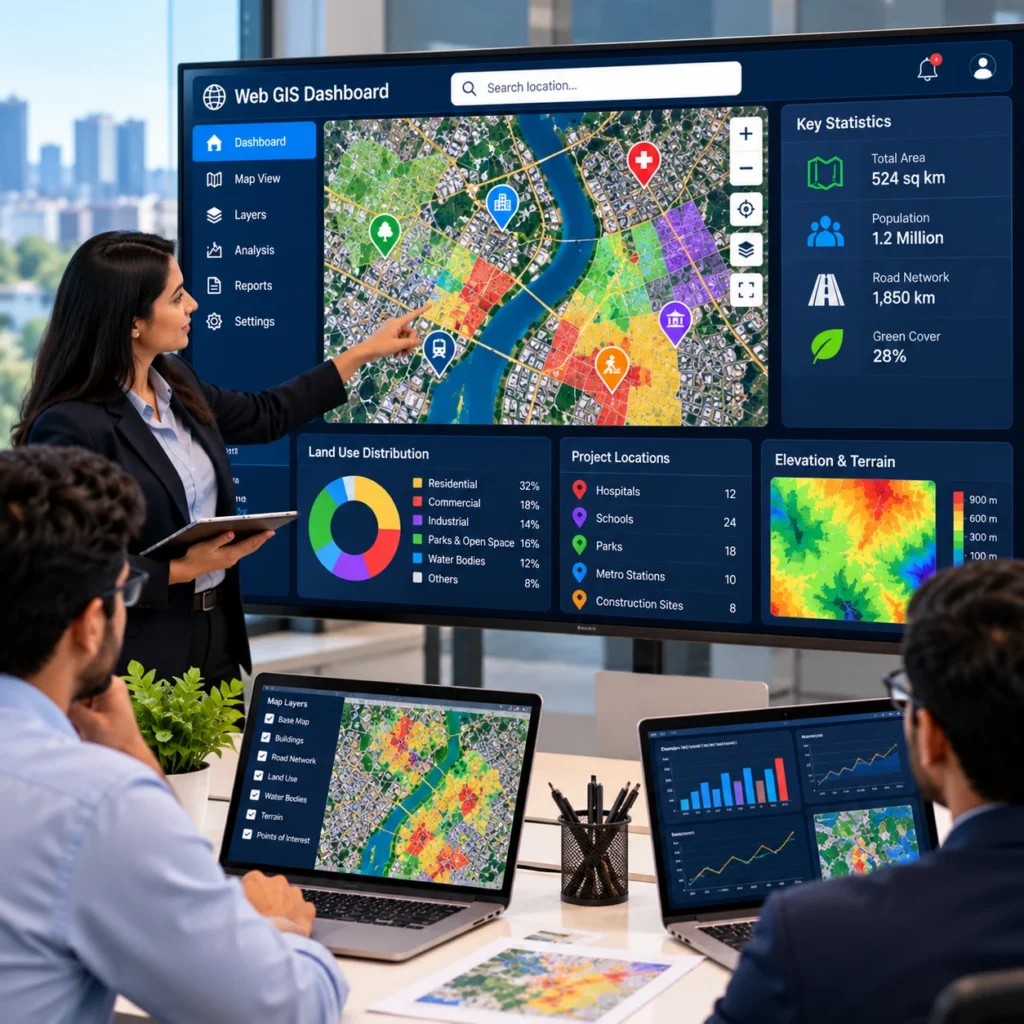
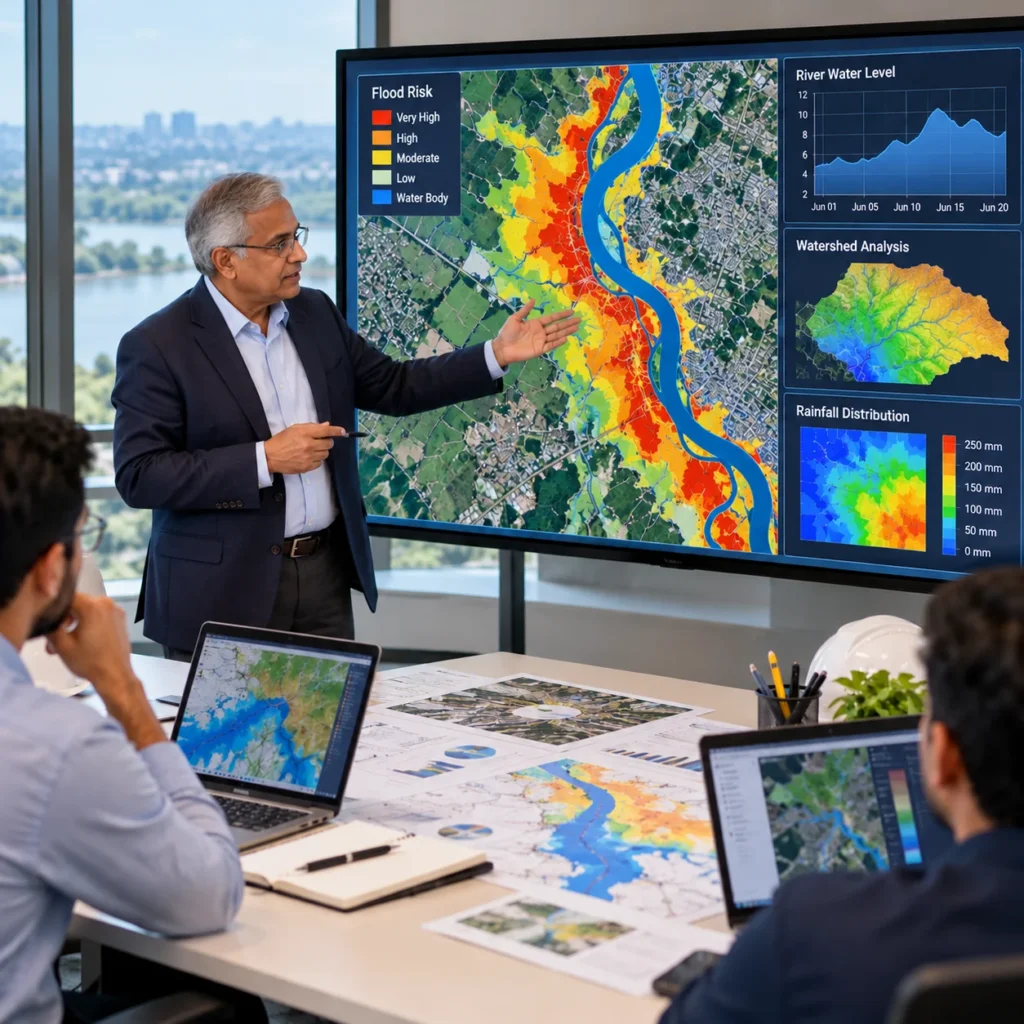
We develop customized Web GIS dashboards and applications to display spatial datasets, monitor assets, and support data-driven planning across different industries.
Our Services Include:
Custom Web GIS applications
Map-based dashboard development
Spatial data integration
Interactive asset and infrastructure maps
Benefits:
Clear geographic insights
Simplified spatial data management
Improved monitoring and reporting
More informed decision-making
Our Web GIS & Interactive Mapping Service Offerings

Real-Time Location Mapping
We integrate supported location data feeds to display updated geographic information for monitoring and operational awareness.

Interactive Land Use Mapping
We create web maps that visualize land-use categories, zoning boundaries, and development areas for planning purposes.

Public Service & Facility Mapping
We develop interactive maps showing hospitals, schools, public offices, and other facilities to improve location-based information access.

Environmental Web Mapping
We present environmental datasets through interactive maps to help users explore land cover, natural resources, and ecological patterns.

Mobile-Friendly Web GIS
We design responsive web mapping interfaces that allow users to explore geographic information on supported smartphones, tablets, and desktop devices.

Geospatial Data Search & Filtering
We develop map-based search and filtering features that help users quickly find locations, geographic features, and relevant datasets.
Problems We Solve with Web GIS & Interactive Mapping
Interactive GIS Mapping
We transform geographic data into interactive maps that help users explore locations, visualize spatial patterns, and understand geographic information.
Web GIS Dashboard Development
We develop map-based dashboards combining geographic data, charts, and key indicators to support monitoring and informed decisions.
Custom Web GIS Applications
We create customized web mapping applications to address project requirements, improve data accessibility, and simplify spatial workflows.
Web-Based Asset Mapping
We map roads, utilities, buildings, and other assets to support infrastructure planning, visualization, and asset management.
Spatial Data Integration
We integrate compatible geographic datasets into unified map views, helping organizations access and interpret spatial information efficiently.
Location-Based Information Systems
We develop location-focused mapping solutions to visualize places, identify geographic patterns, and support location-based decisions.
Thematic Mapping & Data Visualization
We present geographic indicators through thematic maps and visual layers to make regional patterns and spatial trends easier to understand.
Interactive Map Publishing & Sharing
We prepare and publish web-accessible maps that help teams and stakeholders explore and share geographic information.
Urban Planning & Infrastructure Web GIS
We visualize land use, transport networks, utilities, and development areas to support urban planning and infrastructure decisions.
Why us
Why Choose Simbi Labs for Web GIS & Interactive Mapping?
At Simbi Labs India, we develop interactive web maps and customized GIS applications that transform geographic data into useful insights. Our solutions simplify spatial visualization, improve data accessibility, and support smarter planning and decision-making.
- Interactive and user-friendly web maps
- Customized Web GIS applications and dashboards
- Reliable spatial data integration and visualization
- Responsive mapping solutions for different devices
- Focus on usability, accuracy, and project needs
Interactive Mapping Solutions
We create user-friendly web maps with searchable locations, interactive layers, and geographic information.
Experienced GIS Team
Our team applies GIS expertise and structured workflows to develop practical mapping solutions.
End-to-End Web GIS Services
From spatial data preparation to web map development and publishing, we support your project requirements.
Multi-Industry Applications
We support mapping projects across urban planning, infrastructure, utilities, environmental monitoring, and asset management.
GIS & Remote Sensing Solutions Across Multiple Industries
Look at these incridible numbers

About us
We Turn Geographic Data into Interactive Insights
Simbi Labs India develops Web GIS and interactive mapping solutions that help organizations visualize geographic information and make informed decisions.
Our services combine interactive maps, spatial data integration, and customized GIS applications to support urban planning, infrastructure management, and environmental monitoring.
From map development to spatial data visualization, we deliver practical solutions tailored to your project requirements.
Softwares Tools We Use
KoboToolbox
KoboToolbox is a data collection platform widely used for field surveys, research, and geospatial data gathering. It allows users to design digital forms, collect GPS coordinates and survey responses, work offline, and export collected data for further GIS and statistical analysis.
QField
QField is an open-source mobile GIS application designed for professional field data collection. Based on QGIS, it allows users to collect, edit, and manage spatial data in the field, including offline environments, and synchronize survey information with desktop GIS projects.
Mergin Maps
Mergin Maps is a mobile mapping and field data collection platform that works with QGIS projects. It enables surveyors to collect and edit spatial data in the field, including offline areas, and synchronize field changes with centralized GIS projects.
SuperGIS
SuperGIS is a GIS software suite used for mapping, spatial analysis, geographic data management, and visualization. It provides tools for creating digital maps, managing spatial databases, analyzing geographic information, and supporting various professional GIS and surveying applications.
QGIS
QGIS is an open-source Geographic Information System used for mapping, spatial analysis, and geospatial data management. It supports numerous data formats and provides tools for creating maps, analyzing geographic information, editing spatial datasets, and visualizing survey results.
Mappt
Mappt is a mobile GIS and field data collection application designed for capturing and managing geospatial information. It supports GPS-based mapping, spatial data collection, attribute editing, and field workflows, making it useful for environmental surveys, infrastructure inspections, and land surveys.
MATLAB
MATLAB is a programming language and environment for numerical computing and data visualization. It is widely used in engineering and scientific research for tasks such as signal processing, image processing, and statistical analysis
STATA
Stata is a statistical software package used for data analysis and visualization. It is particularly popular in academic research, especially in fields like economics, sociology, political science, and epidemiology
SQL
SQL is a domain-specific language used in programming and designed for managing data held in a relational database management system (RDBMS), or for stream processing in a relational data stream management system (RDSMS)
AtlasTi
AtlasTi is qualitative data analysis (QDA) software that helps researchers uncover complex phenomena hidden in their data. It supports the analysis of textual, graphical, audio, and video data
Tableau
Tableau is a powerful data visualization tool that allows users to create interactive and shareable dashboards.
Bioconductor
Bioconductor is an open-source project for the analysis and comprehension of genomic data. It provides tools for data preprocessing, analysis, and visualization of biological data
Power BI
Power BI is a business analytics service by Microsoft that provides interactive visualizations and business intelligence capabilities
JMP
JMP is a data analysis software from SAS that provides dynamic data visualization and exploration capabilities. It is used for statistical analysis, predictive modeling, and multivariate analysis
Softwares Tools We Use
Have a Web GIS Project in Mind?
Let’s discuss your interactive mapping, Web GIS application, dashboard development, or spatial data visualization requirements. Simbi Labs India helps you transform geographic data into interactive maps and practical insights for smarter decisions.