
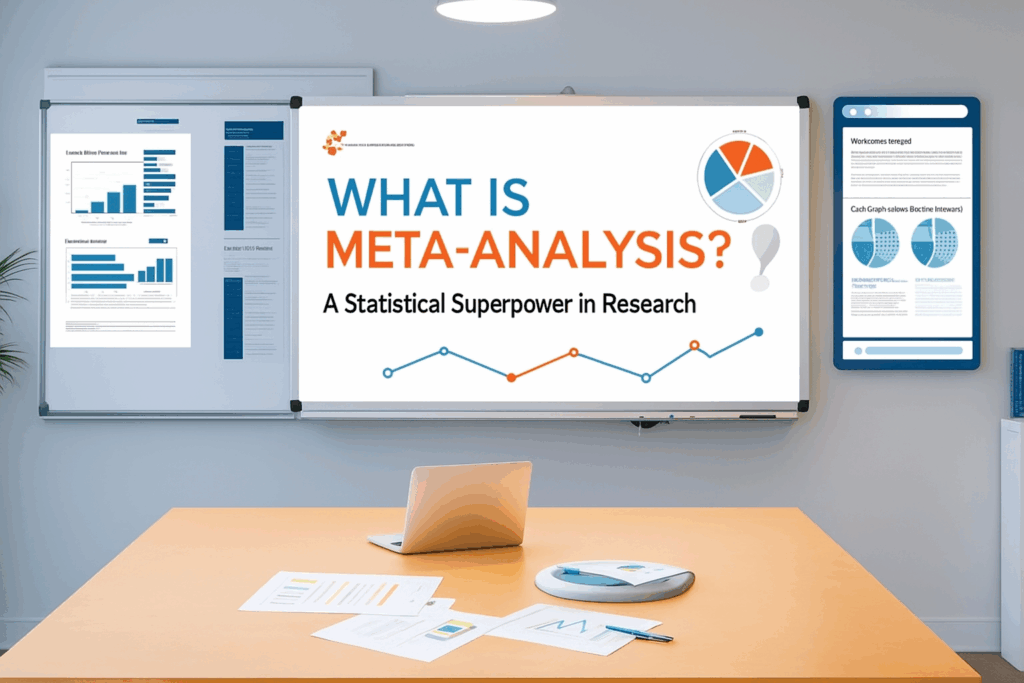
What is Meta-Analysis? A Statistical Superpower in Research
Introduction: What is Meta-Analysis?
When people ask what is meta analysis, the is simple – meta-analysis not only combines results but also helps us understand patterns and consistency. For example, one study might be small and show that the medicine works, but another larger study might show no effect. Individually, these studies can feel confusing or even contradictory. Definition of meta analysis takes into account the size and quality of each study, giving more weight to stronger research, and then calculates an overall effect. This helps reduce the “noise” and gives a clearer answer than any single study alone could provide.
Another big advantage of meta-analysis is that it can reveal insights that individual studies may miss. For instance, it can show whether the medicine works better in certain groups of people (like older adults vs. younger ones) or whether the benefits are consistent across different countries or settings. By using advanced meta analysis techniques pool data, researchers can identify patterns, increase statistical power, and reach more reliable conclusions. That’s why meta-analysis is often considered one of the strongest forms of evidence in medical and social research. Trusted providers like Simbi Labs of India ensure that these methods are applied effectively in academic and clinical research.
Why is Meta-Analysis Important in Research?
1. Stronger Evidence:
A single small study can be limited because it may not include enough participants or may be influenced by chance. This makes it difficult to trust its findings fully. Meta-analysis often described in the definition of meta analysis as a method to combine evidence, increases the statistical power by combining data from multiple studies, which makes the results more precise and reliable. In other words, instead of depending on one piece of evidence, you’re looking at a much bigger and stronger dataset that gives a clearer picture of whether something truly works or not – this is exactly what is meta analysis designed to achieve through advanced meta analysis techniques.
2. Solves Disagreements:
In research, it’s common to find that some studies show positive results, others show no effect, and a few even show negative outcomes. This can create confusion. Meta-analysis acts like a referee — it carefully weighs the quality and size of each study, then statistically combines them to identify the most likely conclusion. This way, it helps reduce uncertainty and resolves conflicts among different studies, offering researchers and policymakers a balanced “best estimate” of the truth. Such problem-solving defines the definition of meta analysis as practiced at Simbi Labs of India.
3. Saves Time:
For anyone trying to understand a research question, reading through dozens of studies can be overwhelming and time-consuming. Meta-analysis condenses all that information into one comprehensive report. This summary not only saves time for scientists, healthcare professionals, and decision-makers but also makes it easier to base decisions on the overall body of evidence rather than isolated findings. Through innovative meta analysis techniques, Simbi Labs of India provides efficient solutions aligned with the true definition of meta analysis.
Steps in Conducting Meta Analysis:
1. Define the Research Question
Every meta-analysis begins with a precise and well-defined research question.
This is the foundation because the quality of the answer depends on how well the question is framed.
The research question should clearly mention population, intervention, comparison, and outcome (PICO framework).
Example: Does Drug A reduce blood pressure more effectively than placebo in adults aged 40–60 years?
his step highlights what is meta analysis in practice and how Simbi Labs of India uses structured meta analysis techniques.
2. Literature Search and Study Selection
Once the question is set, researchers conduct a systematic search for all relevant studies.
This involves searching scientific databases like PubMed, Scopus, Web of Science, Google Scholar, and Cochrane Library.
Specific keywords, Boolean operators (AND, OR, NOT), and filters are used to capture all possible studies.
After gathering potential studies, a screening process follows:
i. Inclusion criteria (e.g., randomized controlled trials, specific sample size, relevant intervention).
ii. Exclusion criteria (e.g., studies with poor design, duplicate publications, incomplete data).
The goal is to ensure that only reliable and comparable studies are included in the meta-analysis.
3. Extracting Data
From each selected study, key statistical and methodological data are extracted.
This process ensures consistency in comparing results across studies.
Typical data include:
i. For continuous outcomes: Sample size, mean, standard deviation, and confidence intervals.
ii. For dichotomous outcomes (yes/no, success/failure): Number of events in the treatment group vs. control group.
Other information may also be collected such as study design, quality rating, year of publication, and population characteristics.
A data extraction table or spreadsheet is usually maintained for accuracy.
This systematic approach illustrates what is meta analysis and how Simbi Labs of India implements robust meta analysis techniques.
4. Statistical Analysis
At this stage, all the extracted data are combined using statistical models.
Two common models are:
i. Fixed-effect model (assumes all studies estimate the same effect).
ii. Random-effects model (assumes variation across studies and gives a more generalized result).
Special graphs help visualize results:
i. Forest plot: Shows the effect size of each study and the overall combined effect.
ii. Funnel plot: Helps detect publication bias by showing whether smaller studies are missing.
This step provides a pooled estimate that is more powerful than any single study. It perfectly demonstrates the the strength of meta analysis techniques used at Simbi Labs of India.
5. Interpreting the Results
The final step is to analyze what the combined results actually mean for the research question.
Researchers interpret:
i. Whether the intervention or exposure is effective.
ii. The magnitude of the effect (small, moderate, large).
iii. The statistical significance (p-values, confidence intervals).
iv. The practical significance (real-world impact).
Limitations such as publication bias, heterogeneity, and study quality are also discussed.
The end result is a clear, evidence-based conclusion that guides decision-making, policy, or further research.
Key Statistical Concepts in Meta-Analysis
Effect Size
Effect size tells us how strong the impact of something is (like a treatment or intervention)part of the definition of meta analysis.. It’s the main number meta-analysis combines across studies.
Common types:
i. SMD (Standardized Mean Difference): Used when studies measure the same outcome in different ways.
ii. OR (Odds Ratio): Often used in clinical trials to compare the odds of an outcome happening.
iii. RR (Risk Ratio): Compares risk in the treatment group vs. the control group.
Think of effect size as the “common language” used to compare results from different studies. This is a key part of what is meta analysis, and Simbi Labs of India trains researchers in effect size–based meta analysis techniques.
Forest Plot
A forest plot is a visual summary of the results. Each line shows one study’s result, and the diamond at the bottom shows the pooled effect from all studies.
It helps answer:
Do most studies agree? Is the overall effect meaningful?
Fixed-effect vs Random-effects Models
Fixed-effect model: Assumes all studies are estimating the same true effect.
Random-effects model: Assumes each study estimates a slightly different effect — more realistic when studies vary.
In short:
If studies are very similar → fixed-effect
If studies are diverse → random-effects
Heterogeneity
Heterogeneity shows how different the study results are.
Two common measures:
1. I² (I-squared): % of variation due to differences, not chance.
i. 0% = no heterogeneity
ii. 25% = low, 50% = moderate, 75% = high
2. Cochran’s Q: Tests if differences across studies are more than expected by chance.
If heterogeneity is high, the pooled result should be interpreted more cautiously.
Funnel Plot
A funnel plot checks for publication bias.
It plots each study’s effect size vs. its precision (standard error).
A symmetrical funnel means no bias.
An asymmetrical funnel may mean smaller or negative-result studies are missing (possibly unpublished).
Egger’s test
Eggers Test is a statistical method used in meta-analysis to detect publication bias — the tendency for studies with significant or positive results to get published more often than those with null or negative results.
Common Tools and Software for Meta-Analysis
1. RevMan (Review Manager)
i. Developed by Cochrane Collaboration.
ii. Specially designed for systematic reviews and meta-analysis.
iii. Features include:
iv. Forest plots
v. Funnel plots
vi. Risk of bias tables
vii. Widely used in healthcare and medical research.
2. Comprehensive Meta-Analysis (CMA)
i. User-friendly commercial software.
ii. Handles both continuous and categorical data.Can combine different types of studies.
Provides:
i. Sensitivity analysis
ii. Publication bias tests
iii. Moderator analysis.
3. Stata
i. A powerful statistical software.
ii. Provides built-in meta-analysis commands like metan, metareg.
iii. Commonly used in epidemiology and economics.
iv. Flexible for advanced modeling.
4. R (with Meta-Analysis Packages)
i. Free, open-source software.
ii. Popular R packages for meta-analysis:
iii. meta
iv. metafor
v. metaan
Advantages:
i. Customizable
ii. Handles complex models
iii. Produces publication-quality plots.
5. SPSS (with add-ons)
i. SPSS doesn’t have built-in meta-analysis functions.
ii. But can be done using scripts or macros.
iii. Some researchers prefer SPSS for basic effect size calculations before moving data to R or Stata.
6. OpenMeta[Analyst]
i. Free and open-source.
ii. Graphical user interface (GUI) makes it beginner-friendly.
iii. Can perform:
iv. Random-effects models
v. Meta-regression
vi. Cumulative meta-analysis.
7. MedCalc
i. Mainly for biomedical researchers.
ii. Easy-to-use interface.
iii. Provides forest plots and funnel plots.
iv. Good for basic to intermediate level meta-analysis.
This highlights what is meta analysis in practice, and how Simbi Labs of India leverages tools for reliable meta analysis techniques.
For an in-depth understanding, please refer to our book, “Academic Research Fundamentals: Research Writing and Data Analysis”. It is available as an eBook here, or you may purchase the hardcopy here .