
Understanding the Kruskal-Wallis Test: A Non-Parametric Approach for Comparing Multiple Groups

The Kruskal-Wallis test is a non-parametric statistical test used to compare the distributions of three or more independent groups. 1 It serves as an alternative to the one-way ANOVA when the assumptions of normality or equal variances are violated or when the data is ordinal. 2 Instead of comparing means, the Kruskal-Wallis test analyzes the ranks of the data across all groups. The test procedure involves combining all data points from all groups and ranking them from lowest to highest. 1 Tied values are assigned the average of the ranks they would have received. 3 Then, for each group, the sum of the ranks is calculated. 2 A test statistic, denoted as H, is computed based on these sums of ranks and the sample sizes of each group. 2 This H statistic reflects the variability between the rank sums of the different groups; a larger H value suggests greater differences. The H statistic is then used to determine a p-value, which represents the probability of observing the obtained results (or more extreme results) if there were no real difference between the groups. If the p-value is less than a predetermined significance level (commonly 0.05), the null hypothesis is rejected, indicating that at least one group’s distribution is different from the others. 1 However, the Kruskal-Wallis test itself doesn’t identify which specific groups differ; post-hoc tests, such as the Dunn-Bonferroni test, are necessary for pairwise comparisons to pinpoint the significantly different groups. 1 While robust to outliers and deviations from normality, the Kruskal-Wallis test is less powerful than ANOVA when the parametric assumptions of ANOVA are met. Therefore, it’s crucial to consider the nature of the data and the research question when choosing between these tests.
How it Works: A Simplified Explanation

Imagine you’re comparing the effectiveness of three different teaching methods. You wouldn’t necessarily assume that student test scores (your data) will be perfectly normally distributed. This is where the Kruskal-Wallis test shines.
Ranking: The test first combines all the data points from all the groups and ranks them from lowest to highest. Tied values are assigned the average of the ranks they would have received.
Sum of Ranks: For each group, the sum of the ranks is calculated.
Kruskal-Wallis Statistic (H): A test statistic, denoted as ‘H’, is calculated based on these sums of ranks and the sample sizes of each group. This statistic essentially measures the variability between the rank sums of the different groups. A larger H value suggests greater differences between the groups.
P-value: The H statistic is then used to determine a p-value. The p-value represents the probability of observing the obtained results (or more extreme results) if there were actually no difference between the groups.
Decision: If the p-value is less than a predetermined significance level (commonly 0.05), we reject the null hypothesis. This means we have sufficient evidence to conclude that at least one group is different from the others
Step-by-Step Guide to Calculate the Kruskal-Wallis Test
The Kruskal-Wallis Test is a non-parametric statistical test used to determine if there are statistically significant differences between the medians of three or more independent groups. This guide will walk you through the manual calculations involved in performing this test, providing a clear and understandable approach.
Preparing Your Data
1. Collect Data: Ensure your data is organized, with one column representing the independent variable (the groups) and another for the dependent variable (the data you want to compare across groups
2. Assumptions Check: Confirm that your data meets the assumptions for the Kruskal-Wallis Test. The test requires that the data from each group be independent and that the dependent variable is at least ordinal.
Manual Calculations
1. Rank the Data: Combine all group observations into a single dataset and rank them from smallest to largest. If there are tied values, assign them the average rank.
2. Sum the Ranks: Calculate the sum of ranks for each group.
3. Calculate the Test Statistic (H):
The formula for the Kruskal-Wallis H statistic is:
H=12n(n+1)∑i=1kRi2ni−3(n+1)
Where n is the total number of observations, k is the number of groups, Ri is the sum of ranks for the ith group, and ni is the number of observations in the ith group.
4. Determine Degrees of Freedom: This is one less than the number of groups being compared.
5. Find the Critical Value: Use a chi-square (χ2) distribution table to find the critical value corresponding to your degrees of freedom and chosen significance level (commonly 0.05).
6. Compare H to the Critical Value: If your calculated H statistic is greater than the critical value from the χ2 table, you can reject the null hypothesis and conclude that there is a significant difference between the groups
Calculating Effect Size (η2)
The Kruskal-Wallis test does not inherently provide an effect size, but one approach to estimate it is through eta squared (η2), calculated as:
η2 = (H – k + 1)/(n – k)
where H is the Kruskal-Wallis statistic, k is the number of groups, and n is the total number of observations.
This provides a measure of how much of the variance in the data is explained by the group differences.
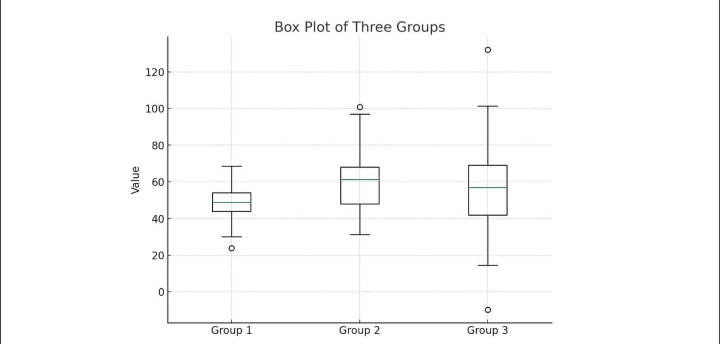
Visual Representation
Consider creating a box plot to visualize the distribution of your data across the groups. This can help in understanding the data and explaining the results.
Interpreting the Results of Kruskal-Wallis Test
Understanding the results of the Kruskal-Wallis Test involves dissecting several crucial components, including the H statistic, p-values, and effect sizes. Additionally, when significant differences are identified, post-hoc analyses are essential for pinpointing specific group differences. This section aims to clarify these elements, providing a comprehensive overview of the analysis outcomes.
H Statistic and P-values
The H statistic is the core outcome of the Kruskal-Wallis Test, signifying the variance among the ranks across different groups. A larger H value suggests a more pronounced difference between group medians. To decipher this statistic:
- The H value is compared against a critical value from the Chi-square distribution, factoring in the degrees of freedom (number of groups minus one).
- The p-value associated with the H statistic indicates the probability of observing the given result, or more extreme, under the null hypothesis. A p-value below the predefined alpha level (usually 0.05) indicates a statistically significant difference among at least one pair of group medians
Effect Sizes
Effect sizes quantify the magnitude of differences observed, offering a dimension of interpretation beyond statistical significance. For the Kruskal-Wallis Test, eta squared (η²) is a commonly utilized measure, reflecting the variance in ranks attributable to group differences. The interpretation of eta-squared values is as follows:
- Small effect: η² ≈ 0.01
- Medium effect: η² ≈ 0.06
- Large effect: η² ≈ 0.14
Software used for kruskal-wallis test
- SPSS (Statistical Package for the Social Sciences):
- SPSS is renowned for its user-friendly graphical interface, making it accessible to researchers with varying levels of statistical expertise.
- Its “Nonparametric Tests” menu provides a straightforward way to execute the Kruskal-Wallis test, along with options for post-hoc analyses to pinpoint specific group differences.
- SPSS is heavily used in social sciences, psychology, and market research, where non-parametric tests are frequently needed.
- It is a paid software.
- R:
- R’s strength lies in its flexibility and extensibility. As an open-source language, it benefits from a vast community that contributes numerous packages.
- The
kruskal.test()function in the base R installation makes performing the test simple. Packages likedunn.testorPMCMRplusprovide post-hoc capabilities. - R is favored by statisticians, data scientists, and researchers who require advanced statistical analyses and customization.
- R is a free software.
- SAS (Statistical Analysis System):
- SAS is a powerful, enterprise-level statistical software suite widely used in industries like healthcare, finance, and pharmaceuticals.
- Its
PROC NPAR1WAYprocedure allows for the Kruskal-Wallis test, among other non-parametric analyses. - SAS is known for its robust data management and analysis capabilities, making it suitable for large and complex datasets.
- SAS is a paid software.
- Python:
- Python’s popularity in data science has led to the development of powerful libraries like SciPy.
- The
scipy.stats.kruskal()function provides a concise way to perform the Kruskal-Wallis test. - Python’s versatility allows for seamless integration with other data analysis and visualization tools.
- Python is a free software.
- Excel (with add-ins):
- While Excel’s native statistical functions are limited, add-ins like XLSTAT expand its capabilities.
- These add-ins provide user-friendly interfaces for conducting the Kruskal-Wallis test within the familiar Excel environment.
- Excel is often used for basic data analysis and reporting, making it convenient for researchers who prefer a spreadsheet-based approach.
- Excel is a paid software, and so are many of its add-ins.
- MedCalc:
- MedCalc is specifically designed for biomedical research, providing a comprehensive set of statistical tools.
- It includes the Kruskal-Wallis test along with other relevant analyses for medical data.
- MedCalc is known for its user-friendly interface and focus on clinical and laboratory data.
- MedCalc is a paid software.
- DATAtab:
- DATAtab is a very user friendly, online statistical calculator. This makes it very accessible to people that do not want to download software.
- Because it is online, it can be used on many different operating systems.
- It is a good option for those that need to quickly run statistical tests.
- DATAtab has a free and a paid version.
Multiple Comparisons and Post-Hoc Tests
Significant findings from the Kruskal-Wallis Test necessitate further examination through post-hoc tests to identify distinct group differences. These tests include Dunn’s, Nemenyi’s, and Conover’s, each tailored for specific conditions and data types. Critical points for conducting posthoc analyses are:
- Choose a post-hoc test that aligns with the study’s objectives and data attributes.
- These tests inherently adjust for the risk of Type I errors due to multiple comparisons, ensuring the integrity of the inferential process.
Common Pitfalls and Avoidance Strategies
- Overemphasis on Significance: A significant p-value doesn’t automatically imply a meaningful or large effect. It’s vital to integrate effect size considerations for a balanced interpretation.
- Distribution Assumptions: Although the Kruskal-Wallis Test is less assumption-bound than its parametric counterparts, it ideally requires comparable distribution shapes across groups, barring median differences. Ensuring this similarity enhances the test’s validity.
By precisely navigating these components, researchers can draw accurate and meaningful conclusions from the Kruskal-Wallis Test, enriching the understanding of their data’s underlying patterns and relationships.
When to Use the Kruskal-Wallis Test:
The Kruskal-Wallis test is your go-to statistical tool when you need to compare three or more independent groups, but your data doesn’t play by the rules of normality. Here’s a quick rundown of when it’s most useful:
- Non-normal data: When your data is skewed, has outliers, or you’re unsure if it follows a normal distribution, the Kruskal-Wallis test is a safe bet.
- Ordinal data: If your data is measured on an ordinal scale (think rankings or ratings), this test is designed for that.
- Comparing medians: While it doesn’t directly test medians, it’s sensitive to differences in them, making it a good choice when that’s your focus.
Essentially, if you’re comparing groups and your data isn’t normally distributed, Kruskal-Wallis is your friend.
Advantages of the Kruskal-Wallis Test:
Robustness: This is a major strength. Many real-world datasets don’t conform perfectly to a normal distribution. They might be skewed (leaning more towards high or low values), have heavy tails (more extreme values than a normal distribution would predict), or contain outliers (unusually high or low values). Parametric tests like ANOVA rely on the assumption of normality, and violating this assumption can lead to inaccurate results. The Kruskal-Wallis test, because it works with ranks instead of raw data values, is much less affected by these deviations from normality. Outliers, for example, might have a large influence on the mean calculated in ANOVA, but they have a limited impact on their rank. This makes the Kruskal-Wallis test a more reliable choice when dealing with messy or unpredictable data.
Versatility: The Kruskal-Wallis test isn’t limited to continuous data that’s normally distributed. It can also be used with ordinal data. Ordinal data represents categories with a meaningful order, but the intervals between the categories might not be equal (e.g., “strongly agree,” “agree,” “neutral,” “disagree,” “strongly disagree”). ANOVA requires data measured on an interval or ratio scale, making it unsuitable for ordinal data. The Kruskal-Wallis test’s ability to handle both continuous and ordinal data makes it much more versatile and applicable to a wider range of research questions.
Simplicity: While the calculations involved in the Kruskal-Wallis test might seem a bit complex at first, the core concept is quite straightforward. It boils down to ranking all the data points and then comparing the sums of ranks across the different groups. This makes the test relatively easy to understand and explain, even to those without a strong statistical background. The focus on ranks rather than raw values simplifies the interpretation and makes it less sensitive to the specific distribution of the data.
Limitations of the Kruskal-Wallis Test:
- Post-hoc tests required: If the test shows a significant difference, you must perform additional post-hoc tests to determine which groups are different. Kruskal-Wallis itself only tells you that a difference exists, not where.
- Less powerful than ANOVA (when assumptions are met): If your data is normally distributed, ANOVA is generally more powerful, meaning it’s more likely to detect a real difference. Using Kruskal-Wallis when ANOVA’s assumptions are met can reduce your ability to find a statistically significant result.
- Doesn’t quantify the difference: The test tells you if groups are different, but not how much they differ. It doesn’t provide a measure of effect size like ANOVA does.
For more query contact:grow@simbi.in
Frequently
Asked Questions
- Use it when you want to compare three or more independent groups and your data doesn't meet the assumptions of a one-way ANOVA (e.g., normality, equal variances). It's suitable for ordinal or continuous data.
- Independent samples.
- Ordinal or continuous dependent variable.
- Similar shapes of distributions across groups (though not necessarily normal).
- Ranking transforms the data, making the test less sensitive to extreme values (outliers). This is crucial when dealing with skewed data or data that violates the assumptions of parametric tests.
- By focusing on the order of the data rather than its exact values, the test becomes more robust.
- Expanding on "similar shapes":
- "Similar shapes" doesn't mean identical distributions. It implies that the distributions shouldn't differ drastically in skewness or kurtosis. If one group is heavily skewed while another is symmetrical, the test's results might be harder to interpret.
- Visualizing the data with boxplots or histograms can help assess if the distributions have reasonably similar shapes.
- Independence:
- The independence of samples is paramount. This means that observations in one group should not be influenced by observations in another group. Violating this assumption can lead to misleading results
- Software nuances:
- Each software package might have slightly different output formats. Understanding how to interpret the output from your chosen software is essential.
- It is also important to understand how each software handles tied ranks, as this can slightly alter results.
- Real-world examples:
- Consider a study comparing the effectiveness of three different teaching methods on student test scores. If the test scores are not normally distributed, the Kruskal-Wallis test would be appropriate.
- Another example is a medical study comparing the effects of different dosages of a drug on patient pain levels, where pain levels are measured on an ordinal scale