
Problem Solving Through Value Stream Mapping (VSM): A Lean Approach to Process Optimization

With the highly competitive business landscape of the current era, organizations are continuously challenged by inefficiencies that impact productivity, customer satisfaction, and profitability. Among the most effective ways of identifying and eliminating such inefficiencies is Value Stream Mapping (VSM). This Lean process enables organizations to map, analyze, and optimize processes, thus a very valuable resource for pursuing operational excellence.
This blog explains how VSM supports orderly problem-solving, what it is constituted of in the main, how it is enforced, and how it can be used to solve common work issues—like slow computer processing in an office.
What is Value Stream Mapping (VSM)?
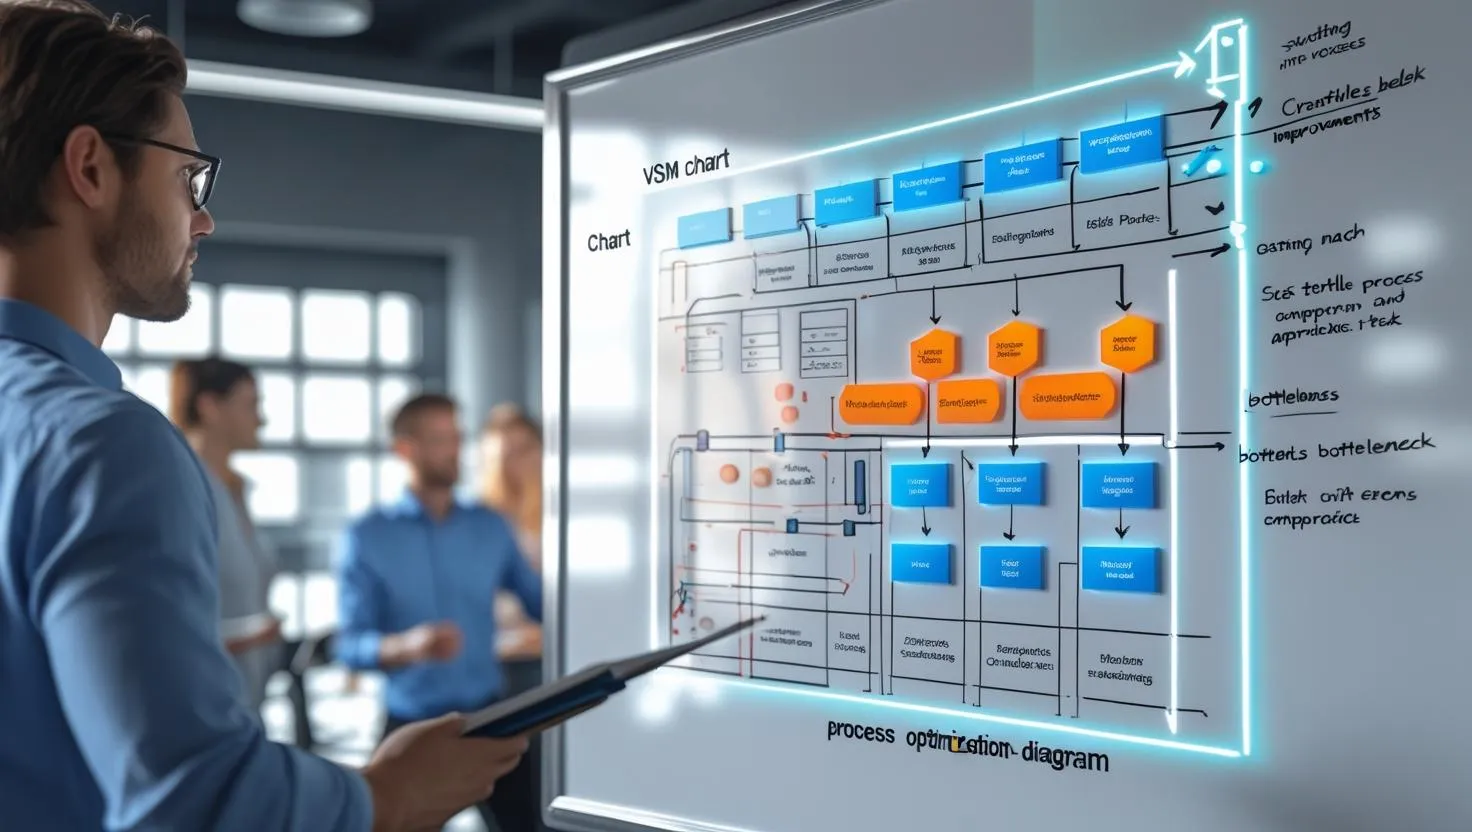
Value Stream Mapping is a Lean management tool that was created to visually map all of the activities performed in an attempt to create a product or provide a service. Value Stream Mapping helps firms map the process of material and information flow from start to finish. The map reveals value adding processes such as work that the customer will pay for and non value adding processes such as waiting, bottlenecks, or excessive steps that are considered waste.
While simple flowcharts can be helpful, VSM offers more accurate information about timing, collaboration, and process waste and is therefore a strategic tool for Lean transformation.
Why Use Value Stream Mapping?
VSM is more than a diagramming technique—it’s a start-to-finish process of learning about and fixing your process environment. VSM is utilized by organizations to:
- Identify Wastes: Detect delays, idle resources, and wasted motion or rework that sap efficiency.
- Streamline Workflow: Remove unneeded steps and schedule tasks more effectively.
- Facilitate Collaboration: Offer an open visual language to align cross-functional teams and enhance communication.
- Aid Lean Initiatives: Implement VSM as part of larger Lean and Six Sigma initiatives for structural process improvement.
- Make Better Decisions: Make decisions based on real evidence of how time, effort, and information are being spent.
Key Elements of a Value Stream Map
A value stream map contains the following key elements:
- Process Steps: All of those steps that are required to complete a task, for example, approvals, data input, or manufacturing.
- Material and Info Flows: Lines illustrating how resources and information flow from one step to the next.
- Timing Data: Contains both cycle time (the duration to finish a task) and lead time (duration to finish something from start to finish, including waiting times).
- Inventory or Queue Points: These indicate where things or work flow back and wait before moving forward, typically an area of concealed inefficiencies.
Knowing these helps businesses know what they are doing correctly and what needs to be changed.
When to Use VSM
Value Stream Mapping comes in handy when you:
- Have recurring delays in routine operations.
- Need to introduce new technologies or processes.
- Observe gaps or misalignment between groups.
- Observe declining productivity or customer satisfaction.
- Are embarking on a Lean transformation or cost reduction project.
A Real-World Scenario: Using VSM to Solve Slow Computer Performance
To gain better insight into VSM in action, consider a typical office problem: slow computer performance. What appears as a minor technical problem, when experienced by multiple employees daily, has a significant impact on overall productivity.
Consider how Value Stream Mapping can effectively solve this problem.
Step 1: Define the Problem
The first step is to clearly define the issue. In this case, office staff are reporting sluggish computer performance. This results in frequent delays while sending emails, entering data, opening applications, and generating reports. The cumulative effect is a loss in daily productivity and an increase in employee frustration.
Step 2: Identify the Process
Next, identify the daily workflow affected by the issue. This typically includes the following steps:
- Turning on the computer very early in the morning.
- Running fundamental software tools.
- Running routine operations like data entry, file management, and reporting.
- Sending messages and attaching files.
All these are the operations that are absolutely vital for employee efficiency and build complete work output.
Step 3: Map the Current State
Next visualize how each of these steps operates within the existing system. For example, booting up the computer could take eight minutes, just because hardware is outdated and too many programs initialize. Opening essential software tools could add another six minutes, especially when RAM is limited or background applications consume memory.
Once the system is finally ready, network file access can take up to five minutes with unreliable connections or server overload. Performing regular functions such as editing documents or running reports can take approximately twenty minutes but consistently interrupted by intermittent delays or freezing. Finally, email and report sending can be delayed by a few minutes with delayed email synchronization or processing.
In total, employees spend nearly half an hour each day waiting on their systems to respond, time that adds no value and diminishes morale.
Step 4: Identify Waste
Now that the current state is mapped, finding wastes is simpler:
- Poor system startup due to old operating systems, low hardware (e.g., insufficient RAM or no SSD), and excessive programs loading automatically.
- Software loading delays usually indicate over-loaded memory, background programs running, or sub-optimal system settings.
- System delays such as repeated disconnections or slow file access are indicators of server overload or insufficient bandwidth allocation.
- Frustration and ineffectiveness from staff are consequences of the above delays, which over a period of time lead to reduced productivity and disconnection.
All the above inefficiencies are non-value-adding activities that must be reduced or eliminated.
Step 5: Create an Action Plan
Based on the issues identified, an actionable improvement strategy can be developed.
Beyond that, hardware upgrades like additional RAM or storage in SSD form can perform miracles to minimize boot time and speed. Software environment optimization by removing startup items unnecessary can make systems boot faster as well as operate more optimally.
It’s also important to examine the organization’s network infrastructure. This may involve assessing router performance, removing unnecessary bandwidth usage, or separating the network to prioritize business-critical applications.
Additionally, training staff on optimal usage habits such as properly shutting down systems and limiting multitasking can further enhance performance.
Assigning the responsibility for each task and setting realistic goals ensures accountability as well as timely completion.
Step 6: Measure the Outcome
After implementing the improvements, noticeable results can be expected. Boot times can drop from eight minutes to just two. Software launches become almost instantaneous. Network access becomes more reliable and consistent. Overall, employees are able to start their day smoothly, complete tasks without interruption, and maintain higher levels of concentration and satisfaction.
This enhanced state of operations not only boosts productivity but also improves employee engagement and reduces IT support requests.
Future State Mapping
With changes implemented, one can draw a future state map to show the streamlined process. This map aids in comparing old versus new performance metrics and maintaining improvements over time.
In our example, staff now spend significantly less time waiting on systems. Their workflows are streamlined, and task completion rates improve, enabling higher throughput for the organization without additional resources.
Best Practices for Implementing VSM into Problem-Solving
For optimal utilization of Value Stream Mapping, implement the following best practices:
- Use cross-functional teams in mapping sessions to maintain accuracy and acceptance.
- Gather real-time data rather than guesses when timings and process flows are concerned.
- Employ visual aids like whiteboards or electronic tools like Lucidchart, Visio, or Miro to enable mapping.
- Be simple in the initial stages and progress towards complicated processes over time.
- Refine and renew your value stream maps at periodic intervals to accommodate changes and enable continuous improvement.
Conclusion: Drive Operational Excellence with VSM
Value Stream Mapping is not just a Lean tool—it is a mindset of constant improvement, alignment of teams, and evidence-based decision-making. With VSM applied, companies are able to transform wasteful processes into streamlined ones, improve service delivery, build a culture of operational excellence.
Whether your goal is to optimize a production line or address issues like sluggish systems on a day-to-day basis, VSM offers the framework and visibility necessary to effectively and sustainably solve problems.