Application of GIS in Geology: Uses, Benefits and Techniques
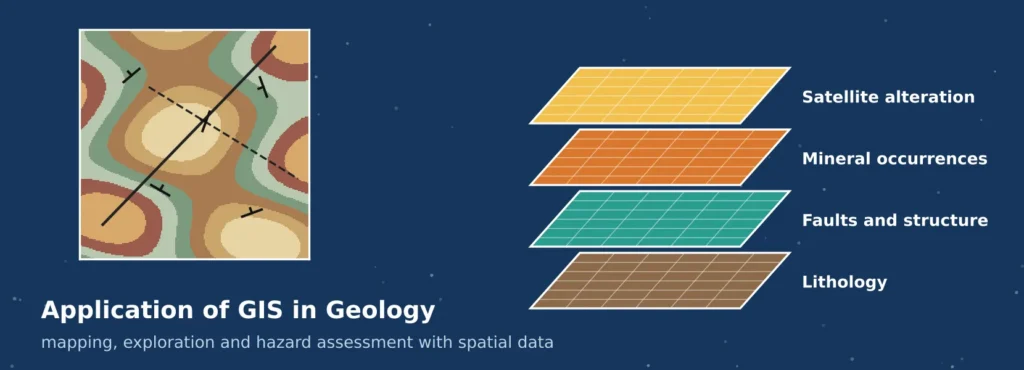
A geologist working in the field records a rock type, a strike and dip, a sample number and a GPS position, and repeats this hundreds of times. The real value appears only when those points are joined to the rock units around them, the faults that cut them, the topography, the chemistry of stream sediments and the signal from satellites. Doing that on paper is slow and hard to repeat. Doing it in a geographic information system turns scattered observations into a model of the ground.
That is the essence of the application of GIS in geology. Modern GIS applications in geology cover almost every branch of the science, from regional geological mapping and mineral targeting to groundwater, landslides, engineering sites and mine management. This article covers the principles, workflows, techniques and tools, and shows two small computed examples so that the methods are easy to follow.
What Is GIS in Geology?
GIS in geology is the use of geographic information systems to collect, store, analyse, model and display geological data that has a location. A geological observation is always about somewhere, whether it is an outcrop, a borehole, a fault trace or a geochemical sample, so geology is naturally spatial. A GIS stores each kind of observation as a layer, links layers through their coordinates, and lets the geologist ask questions that cross layers, such as which granite outcrops lie within 500 metres of a fault and also show a copper anomaly.
Geological data takes several forms, and a GIS handles all of them. Vector data records points such as sample sites and boreholes, lines such as faults and contacts, and polygons such as mapped rock units. Raster data records continuous surfaces such as elevation, magnetic intensity and satellite reflectance. Tables hold laboratory results, drill logs and structural measurements. A three-dimensional extension adds subsurface models built from boreholes and cross-sections.
Importance of GIS in Geological Studies
The application of GIS in geology matters because of integration, speed and repeatability. Geology rarely depends on one data type. A convincing interpretation usually combines rock exposure, structure, geophysics, geochemistry, topography and remote sensing, and a GIS is the common workspace where those sources meet.
- Integration of diverse data. Maps, imagery, geophysical grids and tables are overlaid and compared in one coordinate system.
- Spatial analysis, not just display. Buffers, overlays, interpolation and terrain analysis answer questions that a paper map can only suggest.
- Faster and more repeatable work. A mapping workflow, once built, can be rerun when new samples or imagery arrive.
- Better decisions with less risk. Targets, hazard zones and construction sites can be ranked using evidence layers and tested for sensitivity.
- Clear communication. Maps and 3D views let geologists explain findings to engineers, planners and investors.
Geological surveys have built large digital archives for this reason. The USGS National Geologic Map Database is described as an archive of geoscience maps, reports and stratigraphic information for the United States, with more than 90,000 maps and related reports. In India, the Geological Survey of India launched its Online Core Business Integrated System in 2016, which includes the Bhukosh spatial data portal for sharing geoscientific data. Common data standards such as the OGC GeoSciML model support the exchange of geological map data, boreholes and related information between organisations.
Data Used in Geological GIS Projects
| Data type | Examples | Typical geological use |
| Geological maps | Lithology, age, faults, folds, contacts | Base for interpretation and compilation |
| Field observations | Strike and dip, outcrop notes, GPS-tagged samples, photographs | Ground truth for mapping and structural analysis |
| Topography | DEM, slope, aspect, hillshade, drainage | Landform analysis, structure tracing, hazard and water studies |
| Remote sensing | Multispectral, hyperspectral, thermal and radar imagery | Lithological discrimination, alteration mapping, change monitoring |
| Geophysics | Magnetic, gravity, radiometric and electrical surveys | Subsurface structure, buried rock units, mineral targets |
| Geochemistry | Stream sediment, soil and rock assays | Anomaly mapping and pathfinder analysis |
| Subsurface data | Borehole logs, wells, cross-sections | 3D geological models and resource estimates |
Every layer needs a documented coordinate system, scale and date. A geological map drawn at 1:250,000 and a drone model with centimetre detail cannot be combined casually, because the positional accuracy of one is far lower than the other. Metadata that records source, scale and accuracy is therefore part of the dataset, and not an afterthought. Positional accuracy matters most for GIS in geological mapping, where a boundary drawn from a coarse source can sit hundreds of metres from its true position. Guidance on capturing field data is available in our guides to GIS data collection and GIS survey services.
Geological Mapping Using GIS: A Practical Workflow
Geological mapping using GIS follows the logic of traditional mapping but replaces paper and tracing film with a structured database. GIS in geological mapping improves consistency because rock units, symbols and attributes are defined once and reused. A typical workflow has eight steps.
- Define the scope. Fix the area, map scale and the questions the map must answer, because they decide the level of detail.
- Assemble base data. Collect topographic maps, a DEM, satellite imagery and any existing geological maps, and bring them to one coordinate system.
- Pre-map from imagery and terrain. Hillshade, slope and spectral composites suggest contacts, structures and unit boundaries to test in the field.
- Design the geodatabase. Create layers for units, contacts, faults, structure points and samples, with controlled lists for rock type and age.
- Collect field data. Record locations with GNSS and mobile data collection apps, with strike, dip, lithology and photographs captured as attributes.
- Digitise and clean. Trace contacts and faults, and apply topology rules so that polygons have no gaps or overlaps and boundaries follow the lines.
- Interpret and model. Draw cross-sections, interpolate surfaces, and build 3D models where borehole data exists.
- Check, document and publish. Review against the field data, apply standard map symbols, complete the metadata and export maps and datasets.
Symbol and attribute standards are worth adopting early. In the United States, the FGDC standard for geologic map symbolization is widely followed, and international exchange is supported by GeoSciML. Standards make maps from different teams easier to join and reuse.
Major Applications of GIS in Geology
The seven applications below cover the main ways that geologists use spatial analysis. Figure 1 gives an overview, with the typical output of each.
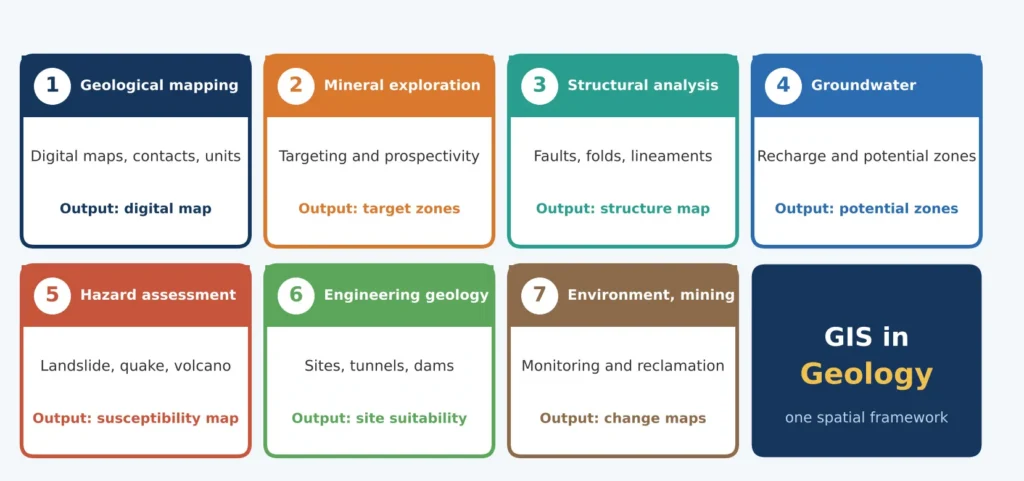
Figure 1: Seven major GIS applications in geology and the main output of each.
1. Geological Mapping and Map Compilation
GIS in geological mapping is the foundation of the other six applications. Digital maps replace sheets of paper, units and structures are stored with attributes, and adjacent maps can be joined and harmonised. Terrain models and imagery help to place contacts where outcrop is poor, and field data is checked against the map continuously. The result is a living map that can be corrected and reissued, with the rock unit database behind it available for analysis.
2. GIS in Mineral Exploration
GIS in mineral exploration helps to narrow a very large area to a small number of targets worth drilling. Exploration usually follows a mineral systems view: a deposit forms where a source of metal, pathways for fluids, a trap and favourable chemical conditions coincide. Each can be represented by a map layer, or proxy, such as favourable host rock, proximity to faults, geochemical anomalies and alteration signatures from satellite imagery.
Prospectivity mapping combines those layers. In a knowledge-driven approach, geologists assign weights using a deposit model and combine layers with weighted overlay or fuzzy logic. In data-driven approaches, such as weights of evidence or machine learning, the weights are learned from known deposits. Figure 2 shows a small knowledge-driven example on synthetic data: four evidence layers are combined with weights set by judgement, and 12 synthetic known deposits are overlaid afterwards. Eight of the 12 fall in the top 10 percent of the area, against about one expected by chance. The data are synthetic and were built to illustrate the method, so the result shows how the test works and not how well the method performs in practice.
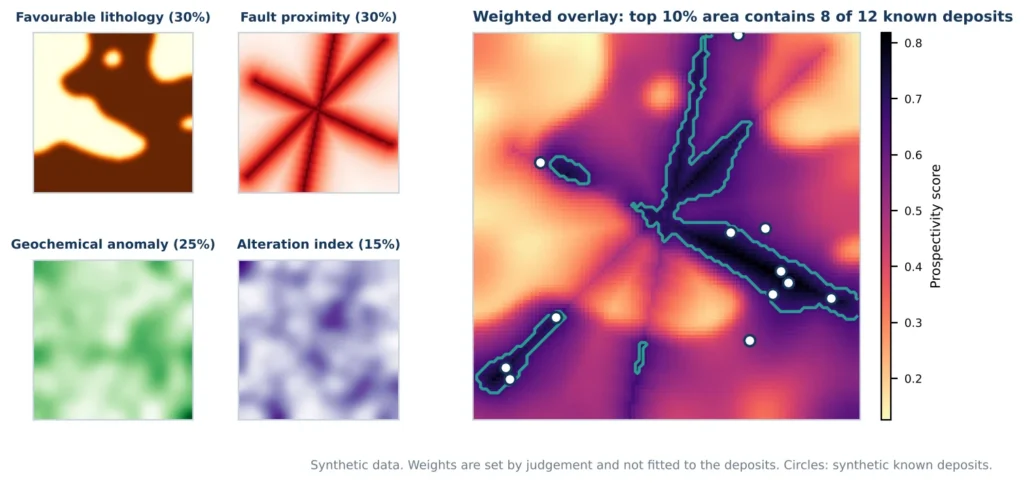
Figure 2: A weighted-overlay prospectivity map built from four synthetic evidence layers.
Remote sensing contributes alteration proxies. Band ratios highlight iron oxides, such as the red to blue ratio, and clay minerals, such as the ratio of the two shortwave infrared bands. These indicate surface alteration, not mineralisation itself, and vegetation, soil and weathering can hide or mimic them. A prospectivity map ranks places by evidence, so it should be validated against independent data and used to prioritise field checks and drilling, never as proof that a deposit exists.
3. Structural Geology and Lineament Analysis
Faults, joints and folds control the movement of fluids, the location of ore and the stability of slopes. A GIS stores structural measurements as oriented point symbols and supports contouring of orientation data, fault mapping and the extraction of lineaments from terrain models and imagery. Lineaments are linear features that may reflect fractures or faults, and their orientation and density are summarised with rose diagrams and density maps.
Figure 3 uses 62 synthetic lineaments to show the method. Azimuths were computed from the line coordinates and grouped in 10-degree bins. Thirty-six of the 62 traces, or 58 percent, fall between 30 and 60 degrees, giving a clear north-east trend, with a smaller north-west set of 17 traces. In real work, lineaments traced from imagery must be verified in the field, because roads, field boundaries and shadows can create false lines.
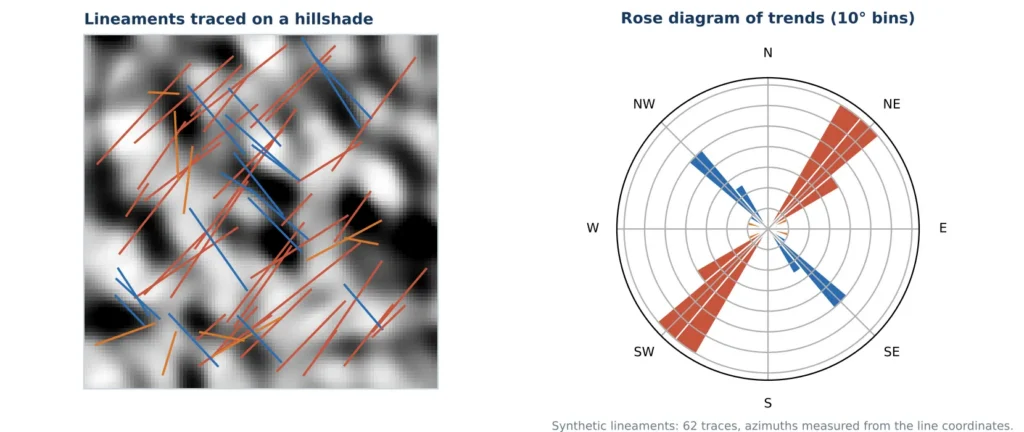
Figure 3: Synthetic lineaments on a hillshade, with a rose diagram of their trends (red: 30 to 60 degrees; blue: 120 to 160 degrees; orange: other).
4. Groundwater Exploration
Groundwater occurrence depends on rock type, fracturing, slope, drainage and recharge. Groundwater potential mapping combines layers such as lithology, lineament density, slope, drainage density, land use and rainfall, weighting them with expert judgement or statistical methods. Results are checked against well yield and water level records. The maps guide where to site wells or recharge structures, but they are probabilistic, so field investigation is still needed.
5. Natural Hazard Assessment
Landslide susceptibility mapping relates past landslide locations to controlling factors such as slope, lithology, distance to faults and streams, rainfall and land cover, using methods that range from weighted overlay to logistic regression and Random Forest. Models should be tested on landslides that were not used to build them, using measures such as the area under the ROC curve. GIS also supports earthquake hazard work through fault mapping, ground-condition and liquefaction zoning, and volcanic hazard work through lava-flow and ash-fall modelling.
6. Engineering Geology and Infrastructure
Dams, tunnels, highways and foundations depend on ground conditions. GIS combines borehole data, rock quality, weathering depth, groundwater and slope stability to rank route or site options, and 3D models show how units change along a proposed alignment. It also helps locate construction materials such as aggregate, and it records geotechnical data in a form that engineers can reuse.
7. Environmental Geology and Mining Management
Mines change the landscape quickly. Satellite imagery tracks pit expansion, waste dumps and tailings, radar interferometry detects ground subsidence, and geochemical maps establish baselines and show contaminant spread. GIS supports reclamation planning, monitoring of water quality and compliance reporting, and the same tools help assess contaminated land and landfill sites.
Core GIS Techniques Used by Geologists
| Technique | What it does | Geological example |
| Overlay and raster algebra | Combines layers using logical or arithmetic rules | Prospectivity and hazard modelling |
| Buffer and proximity analysis | Measures distance to features | Zones within 500 m of a fault |
| Spatial interpolation | Estimates values between samples (IDW, kriging) | Geochemical surfaces, groundwater levels |
| DEM derivatives | Slope, aspect, curvature, hillshade, drainage | Landform and structure interpretation |
| Remote sensing analysis | Band ratios, classification, principal components | Lithology and alteration mapping |
| Spatial statistics | Tests clustering and relationships | Deposit clustering, hot spots of anomalies |
| 3D modelling and cross-sections | Builds subsurface models from boreholes and maps | Orebody and aquifer geometry |
GIS Software Commonly Used by Geologists
The application of GIS in geology rarely depends on one package. Most teams combine a general GIS with specialist tools for remote sensing, geophysics and 3D modelling.
| Software | Type | Typical geological use |
| QGIS | Open source | Map compilation, DEM analysis, plugins for classification and 3D views, field data workflows |
| ArcGIS Pro | Commercial | Geodatabase design, geoprocessing, cartography and 3D scenes, common in survey organisations |
| GRASS GIS and SAGA GIS | Open source | Terrain, hydrological and raster modelling, geostatistics |
| ENVI and ERDAS IMAGINE | Commercial | Multispectral and hyperspectral image analysis, mineral and alteration mapping |
| ESA SNAP | Free | Processing of Sentinel optical and radar data, including interferometry |
| Global Mapper | Commercial | Terrain and LiDAR analysis, volume and profile tools |
| Leapfrog Geo, GeoModeller | Commercial | 3D geological modelling from boreholes, maps and structure |
| Oasis montaj | Commercial | Processing and interpretation of geophysical data |
| Micromine, Surpac | Commercial | Mining geology, drillhole databases and resource modelling |
| Google Earth Engine | Cloud platform | Large-scale satellite analysis, free for research and non-commercial use |
| Python and R | Open source | Scripted workflows, machine learning and repeatable analysis |
The choice depends on budget, data type and team skills. Open-source tools reduce cost and allow scripting, while commercial packages often offer specialised modules and support. Whatever the software, using open formats and documented workflows keeps data usable when tools change.
Benefits of GIS in Geology
- Reduced exploration cost and risk. Better targeting means fewer unproductive drill holes and field days.
- Time saving. Automated overlay, digitising and reporting replace repetitive manual work.
- Consistency and traceability. Every layer, parameter and decision can be documented and rerun.
- Safer fieldwork. Pre-mapping from imagery and terrain helps to plan routes and avoid hazards.
- Earlier detection of change. Imagery and radar reveal mine expansion, ground movement and slope failure sooner.
- Shared understanding. A common spatial framework lets geologists, engineers and managers work from the same evidence.
Challenges and Limitations
The application of GIS in geology has real limits, and planning for them is part of good practice.
- Data quality and scale mismatch. Old maps may be inaccurate or drawn at coarse scale, and combining them with precise new data needs care.
- Interpretation is still human. GIS handles data, but the geological reasoning about processes, ages and structure comes from the geologist.
- Uncertainty in 3D. Subsurface models rest on sparse boreholes and interpretation, so they carry real uncertainty that should be stated.
- Surface-only evidence. Remote sensing sees the surface, and cover such as soil, vegetation or regolith can hide the geology.
- Model bias. Prospectivity and hazard models built from known deposits or past events can overlook unexplored settings.
- Skills and cost. Specialised software and training require investment, particularly for 3D and geophysical work.
Best Practices for Dependable Results
These habits apply to every application of GIS in geology, from a small mapping job to a regional study.
- Document sources and accuracy. Record the scale, date and positional accuracy of every layer.
- Use standards. Apply common symbols, controlled vocabularies and data models where possible.
- Verify remote sensing in the field. Check lineaments, alteration zones and unit boundaries on the ground.
- Keep raw data separate. Preserve original data and record every processing step.
- Test models independently. Validate prospectivity and hazard maps against data not used to build them.
- Show uncertainty. Present confidence, error and data gaps next to results.
- Review with geologists. Let domain experts challenge model outputs before decisions are made.
Future of GIS Applications in Geology
Several trends are widening what GIS can do for geology. Machine learning is being used for lithological classification, prospectivity modelling and landslide mapping, though it still needs good labels and independent testing. Drones and LiDAR give centimetre-scale outcrop models, hyperspectral imagery separates minerals more finely, and radar interferometry monitors ground movement at millimetre scale. Cloud platforms and open data make large archives available without local infrastructure, and 3D and four-dimensional models are making it easier to show how subsurface conditions change with time. The principle stays the same: more data helps only when it is organised, checked and interpreted by someone who understands the geology.
Conclusion
The application of GIS in geology gives geologists a single framework for observations that were once scattered across paper maps, notebooks and files. It improves geological mapping using GIS, makes GIS in mineral exploration more systematic, supports structural, groundwater, hazard and engineering studies, and strengthens environmental monitoring around mines. Its strength depends on the discipline behind it: documented data, standards, field verification, independent testing of models and honest statements of uncertainty.
Simbi Labs India supports research and projects that need GIS analysis, field data collection and mapping. Visit our contact page, book an appointment or reach us on WhatsApp.
Frequently Asked Questions
- What is the application of GIS in geology?
It is the use of GIS to store, analyse and map geological data, supporting geological mapping, mineral exploration, structural analysis, groundwater studies, hazard assessment, engineering geology and environmental monitoring. - How is GIS used in geological mapping?
Geologists build a geodatabase of units, contacts, faults and structure points, collect field data with GPS, digitise boundaries with topology rules, and use terrain and imagery to guide interpretation. - Can GIS find minerals?
GIS does not find minerals by itself. It combines evidence layers to rank areas by prospectivity, and the ranking guides field checks and drilling. - Which GIS software is best for geologists?
QGIS and ArcGIS Pro are the usual general-purpose choices, supported by specialist tools such as ENVI for imagery, Leapfrog Geo for 3D models and Oasis montaj for geophysics. - Is remote sensing necessary?
It is not essential, but it adds wide coverage of lithology, alteration and structure, especially where access is difficult.