
Digital Elevation Model (DEM) for Terrain Analysis: Mapping Elevation, Slope and Low-Terrain Zones Using GIS
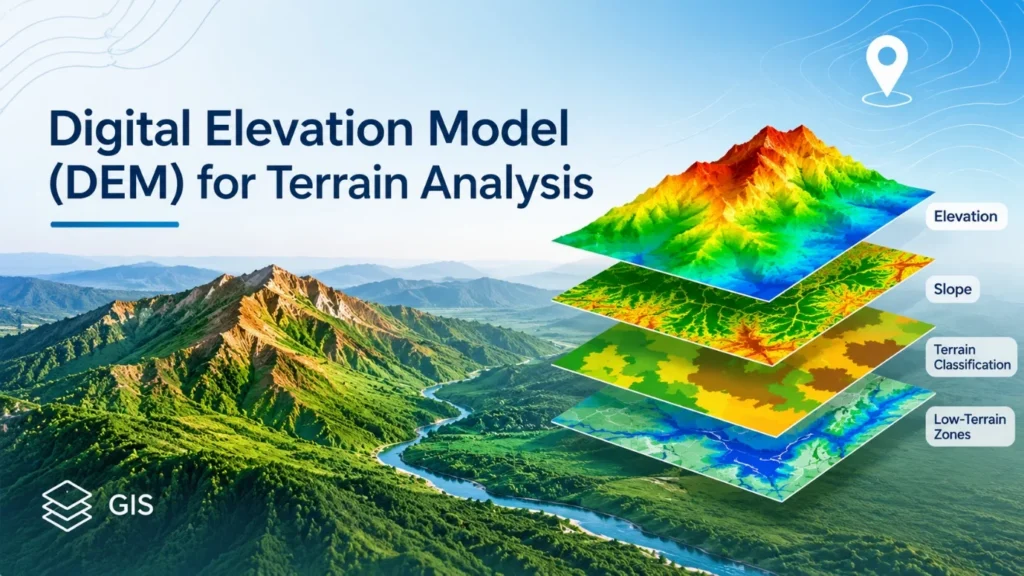
The knowledge about the characteristics of the land surface is crucial for the development of infrastructure, urban planning and environmental management. Elevation, slope and terrain configuration will affect drainage patterns, construction suitability and the vulnerability to the environment. These geographical characteristics are analyzed systematically by considering spatial elevation data with the help of a Digital Elevation Model (DEM).
A Digital Elevation Model is a type of raster data that has cells with elevation values (usually in metres) representing the surface of the Earth. This information can be used in Geographic Information Systems (GIS) to determine terrain elevation differences, slope gradients, terrain classification and to identify relatively low-lying terrain.
Digital Elevation Model (DEM) Analysis converts the elevation data into useful geographical spatial data which is used for geographical assessment and intelligent planning.
READ MORE: Powerful GIS Terrain Mapping Techniques for Better Insights
How DEM Data Supports Terrain Analysis
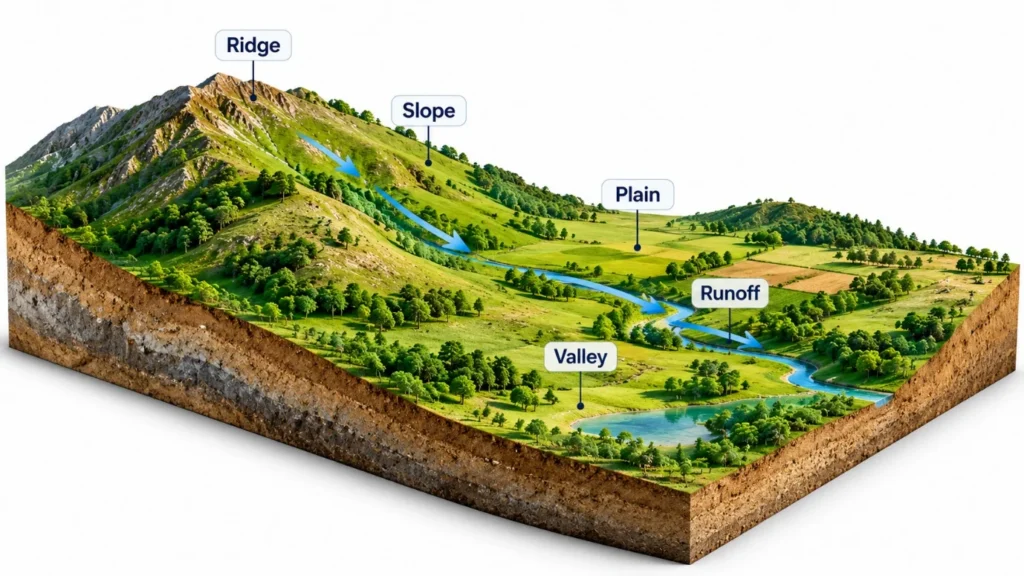
DEM data are used to gain an understanding of the topographical variations of a geographical area. They are used to find plains, hills, valleys, ridges and depressions because of their elevation.
Some of the common sources of elevation data are Shuttle Radar Topography Mission (SRTM) and Copernicus DEM and ASTER Global Digital Elevation Model. It depends on geographical coverage and spatial resolution, vertical accuracy and project requirements.
DEM-based terrain analysis supports:
- Identifying elevation differences across locations.
- Examining surface gradients and terrain steepness.
- Locating relatively low-lying areas and depressions.
- Understanding terrain characteristics influencing surface runoff.
- Assessing geographical suitability for infrastructure development.
- Supporting watershed and environmental management.
The higher the resolution the smaller detail that can be resolved, however, the accuracy and suitability of the datasets will also need to be assessed prior to processing.
DEM Analysis Using QGIS
QGIS has tools to process, analyze and visualize DEM datasets. It has raster processing capabilities, which enable users to create elevation maps, compute slopes, create hillshade images and classify terrain.
A typical DEM analysis workflow using QGIS involves the following operations.
- Loading DEM Data: Import the elevation raster using the Add Raster Layer option. Check its coordinate reference system (CRS), resolution, elevation units and geographical extent.
- Clipping the Study Area: Use the Clip Raster by Mask Layer tool to extract the required geographical area using an administrative or project boundary.
- Generating Elevation Maps: Apply Singleband Pseudocolor symbology to represent different elevation ranges using graduated colours.
- Calculating Slope: Use the Slope tool in the QGIS Processing Toolbox, including GDAL terrain analysis, to generate a raster representing land-surface steepness.
- Generating Hillshade: Apply the Hillshade tool to create a shaded terrain representation that improves the visual interpretation of ridges, valleys and surface variations.
- Classifying Terrain: Use Raster Calculator and reclassification tools to group elevation and slope values into meaningful categories.
Figure 1. DEM processing workflow in QGIS, illustrating raster loading, clipping, slope calculation and terrain classification.
READ MORE: Powerful GIS Terrain Mapping Techniques for Better Insights
Elevation Mapping: Understanding Land Height Variations
Elevation mapping is an expression of the height of the land over an area. It is useful to differentiate raised areas from plains or valleys and relatively low ground areas.
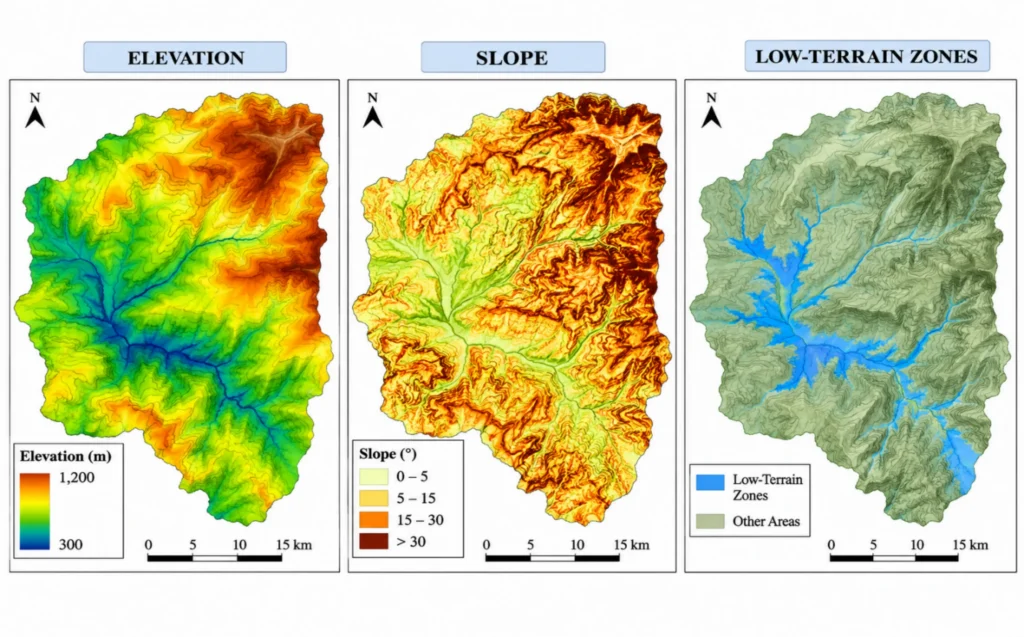
The graduated colour ramps can be set on the values of a DEM raster in QGIS. The green and blue colours may be lower elevations, the yellow, orange and brown colors may be higher elevations. The key to interpretation is a good legend and units of elevation.
Elevation classification assigns values of a raster to one of a set of intervals for easier geo-graphical comparison. These maps help people plan and design urban areas, to assess sites and for environmental studies, showing the variations in topography.
Elevation is not the only indicator of development suitability or flood potential, however. The drainage condition, precipitation, soil properties and topography should also be taken into account.
READ MORE: Powerful Slope Analysis QGIS for Accurate Terrain Insights
Slope Mapping and Terrain Gradient Assessment
Elevation gives the height of a place while slope gives the rate of change of elevation with respect to a horizontal distance. Slope mapping helps to determine differences in terrain steepness.
Slope is calculated in QGIS based on the difference in elevation in adjacent cells of a raster. The values obtained are typically written as degrees or percentage. The angle of the slope (degrees) and the percentage slope (vertical rise over horizontal distance).
| Terrain Category | Slope Range |
| Flat | 0–2° |
| Gentle | Greater than 2–5° |
| Moderate | Greater than 5–15° |
| Steep | Greater than 15–30° |
| Very Steep | Greater than 30° |
Note: These are indicative ranges and should be adjusted according to local terrain conditions and project requirements.
Road alignment, infrastructure planning, erosion assessment, land suitability studies are a few uses for slope information. They may need more engineering attention in steeper terrain, or more attention to drainage conditions in flatter. In steeper terrain, they may require additional engineering considerations, in flatter terrain more attention to drainage conditions.
Terrain Classification Using DEM
The classification of terrain is a classification of geographical surfaces based on their physical attributes. Slope and elevation are key variables to delineate various landform conditions.
GIS raster reclassification tools are used to assign slope or elevation values to a set of categories. These layers can also be combined to develop a broader representation of the study area’s topography.
| Terrain Type | General Characteristics |
| Low-Gradient Plains | Flat surfaces with limited elevation variation |
| Elevated Plains | Higher elevation with gentle gradients |
| Rolling Terrain | Repeated elevation variations and moderate slopes |
| Hilly Terrain | Noticeable elevation differences and steeper gradients |
| Mountainous Terrain | Significant elevation variation and steep slopes |
The classification criteria should be based on geographical features of the area. Elevation and slope together, give a more complete picture than elevation alone.
Low-Terrain Zone Identification Using GIS
Low terrain identification is one of the major applications of Digital Elevation Model (DEM) Analysis that is very useful in urban planning, drainage evaluation and environmental studies.
Low-lying areas are places that are relatively low in elevation compared to the surrounding area. These can affect surface water flow as water can drain into lower areas of a landscape where it may converge or pool.
GIS supports low-terrain identification through several techniques.
- Elevation Threshold Classification: Raster Calculator and reclassification tools can extract locations below a selected elevation threshold based on the study area’s elevation distribution.
- Slope-Based Assessment: Combining elevation and slope layers helps distinguish relatively flat, low-elevation surfaces from steeper terrain.
- Hydrological Analysis: Flow Direction and Flow Accumulation tools identify potential surface-water pathways and locations receiving runoff from surrounding areas. Sink and depression analysis can further support terrain assessment.
- Spatial Overlay Analysis: Low-elevation zones can be compared with drainage networks, roads, buildings and land-use layers to understand their relationship with existing infrastructure.
In the initial flood susceptibility and drainage investigations, low terrain identification is helpful. But just because an area is lower does not make it a flood hazard. Additionally, the intensity of rainfall, drainage capabilities, soil infiltration, and land cover and hydraulic conditions need to be assessed.
Practical Applications of DEM-Based Terrain Analysis
DEM-based terrain analysis supports geographical planning and infrastructure-related assessments across several sectors.
| Application Area | Role of DEM Analysis |
| Urban Planning | Examines elevation and slope conditions |
| Flood Assessment | Supports low-lying area and runoff identification |
| Road Infrastructure | Evaluates terrain gradients for route alignment |
| Watershed Management | Supports catchment and drainage assessment |
| Land Suitability | Provides topographical indicators for site evaluation |
| Environmental Monitoring | Helps examine terrain and erosion-related patterns |
The integration of elevation, slope, drainage and land-use data can help to gain a better understanding of the geographical conditions that affect infrastructure development and environmental management.
Improving the Accuracy of DEM Analysis
Reliable terrain assessment depends on elevation data quality and appropriate processing methods. Spatial resolution should be selected according to the geographical scale and objectives of the study, while vertical accuracy must be evaluated to minimise errors that could affect slope calculations and low-terrain identification. An appropriate Coordinate Reference System (CRS) should be used to ensure accurate spatial measurements and compatible units. Data consistency is equally important, particularly when working with datasets that differ in resolution, vertical datum or geographical coverage. Additionally, field validation through on-site observations or reliable reference datasets helps verify the accuracy of the analytical results.
Incorporating elevation thresholds should not be done in a blanket fashion from one geographic area to the next. The outputs of DEM can be used in conjunction with hydrological data to further enhance the reliability of terrain assessment.
Conclusion
Digital Elevation Model (DEM) Analysis is an effective means of mapping elevation, calculating slope, terrain classification and identification of low lying areas. These processes can be applied on a structured GIS workflow which can be implemented in QGIS and converts a raster elevation layer into meaningful spatial information.
DEM-based terrain analysis can be used to inform geographical decisions, ranging from urban development to infrastructure planning, watershed management and environmental assessments. The addition of elevation, slope and drainage information with land use provides an enhanced understanding of the land surface conditions.
At Simbi Labs, GIS-based spatial analysis, terrain assessment and geospatial data processing help organisations transform geographical datasets into actionable planning insights, supporting informed infrastructure development and environmental management.
Frequently Asked Questions (FAQs)
1. What is a Digital Elevation Model (DEM)?
A Digital Elevation Model (DEM) is a digital representation of the Earth’s surface in which raster cells contain elevation values. It is used to examine terrain characteristics such as land height, slope, valleys and elevated areas.
2. What is the purpose of DEM analysis in GIS?
DEM analysis helps identify elevation variations, calculate slope gradients, classify terrain and locate low-lying areas. It supports urban planning, infrastructure development, drainage assessment and environmental management.
3. How is DEM analysis performed using QGIS?
DEM analysis in QGIS involves loading elevation data, clipping the raster to the study area, generating elevation maps, calculating slope, producing hillshade outputs and classifying terrain using raster processing tools.
4. How are low-terrain zones identified using GIS?
Low-terrain zones are identified by examining DEM elevation values and selecting appropriate elevation thresholds. Slope analysis, flow accumulation and spatial overlay techniques can further improve the assessment of these areas.
5. What is the difference between elevation mapping and slope mapping?
Elevation mapping represents the height of land above a defined vertical reference, whereas slope mapping measures the steepness of the land surface. Both are important for understanding geographical terrain conditions.
6. Which DEM datasets are commonly used for terrain analysis?
Commonly used datasets include SRTM, Copernicus DEM and ASTER Global Digital Elevation Model. The appropriate dataset depends on spatial resolution, vertical accuracy, geographical coverage and project requirements.
7. How does DEM analysis support flood assessment?
DEM analysis helps identify relatively low-lying areas, potential drainage pathways and locations where surface runoff may accumulate. Combining elevation data with rainfall, drainage and hydrological information provides a more comprehensive flood susceptibility assessment.
8. What are the major applications of Digital Elevation Model (DEM) Analysis?
Major applications include urban planning, road alignment, watershed management, flood susceptibility assessment, land suitability analysis, infrastructure development and environmental monitoring.