
GIS-Based Terrain Mapping: Analysing Elevation and Landforms of Barabar Hills, Bihar
In short: this guide shows how to map the elevation and landforms of the Barabar Hills with a digital elevation model and free GIS software. It describes the method and does not report measured results for the hills.
The Barabar Hills of Bihar are best known for the Mauryan rock-cut caves but also a good place for practising terrain analysis. Free elevation data can be used to measure granite outcrops, slopes and drainage lines. In this section you will learn the most common GIS terrain mapping techniques, the approach used to map elevation on GIS, how to perform landform analysis on GIS, and how the results of landform analysis can be rendered as a finished map by applying topographic mapping techniques to hills. The guide ends with a plan for terrain analysis of the Barabar Hills.
1. The Site at a Glance
Where: Makhdumpur region, Jehanabad district, Bihar, about 24 km north of Gaya, at roughly 25.005°N, 85.063°E.
Hills: Barabar Hill has four caves, and Nagarjuni Hill, about 1.6 km away, has three.
Rock: Granite, described as an extremely hard rock.
Caves: Karan Chaupar, Lomas Rishi, Sudama and Visvakarma at Barabar; Gopika, Vadathika and Vapiyaka at Nagarjuni. They date to the Maurya period, 322 to 185 BCE, and their interiors have the polished finish known as Mauryan polish.
Summit: Siddheshwar Peak carries a temple and is reached by a concrete path and steps.
2. Why Terrain Mapping Helps Here
A terrain map is useful for heritage documentation in order to document the setting of the caves. It aids in the planning of visits as it gives an indication of the difficulty of a path by slope and elevation. It indicates the direction of flow of rain water on rock and soil and provides a good visual idea of the shape of the hills.
3. Choose Your Elevation Data3
Every terrain analysis starts with a digital elevation model, or DEM, a grid that stores elevation for each cell. The options are compared below.
| Data source | Resolution | Notes |
| SRTM (NASA / USGS) | 1 arc-second, about 30 m | Void-filled version available; check vertical accuracy before use |
| Copernicus DEM (GLO-30) | About 30 m | Check the licence and version before client use |
| Drone survey | Centimetre to decimetre level, depending on flight plan | Best for caves, steps and rock faces; needs ground control and flight permission |
| GPS field points | Point measurements | Used to check the DEM and record cave and summit locations |
SRTM data has a resolution of one arc-second, about 30 m, so each cell covers roughly 30 m by 30 m. Features smaller than that, such as steps or cave entrances, will not appear clearly.
4. GIS Terrain Mapping Techniques: The Workflow
GIS terrain mapping techniques follow the same path for any hill, summarised in Figure 1.

Figure 1: A five-step GIS terrain mapping workflow.
Step 1 – Get the DEM
Download elevation data for the area and clip it to a boundary around the hills.
Step 2 – Prepare the data
Check for voids or errors. Then reproject the DEM to a projected system. The Barabar Hills lie at about 85°E, so UTM zone 45N (EPSG:32645) is a suitable choice, because slope needs metres and not degrees.
Step 3 – Derive terrain products
Create contours, slope, aspect, hillshade and ruggedness layers.
Step 4 – Classify landforms
Group cells into summit, ridge, slope, valley and plain.
Step 5 – Verify and map
Check results against field points and photographs, then prepare the layout.
5. Elevation Mapping Using GIS
The GIS-based elevation mapping process converts the raw cell values into maps that can be understood by people. Colour the DEM by elevation bands to make hypsometric tints, so that high and low ground stand out. Create contour lines at an appropriate interval, tight for gentle terrain and wider for steep terrain. Lastly, illustrate an elevation profile for a path to indicate its steepness. Always include contour interval and data source on the map.
6. Landform Analysis Using GIS
Landform analysis using GIS rests on a few derived layers. Figure 2 shows four of them from a synthetic surface, so the patterns are easy to see. The table lists the QGIS tool for each.
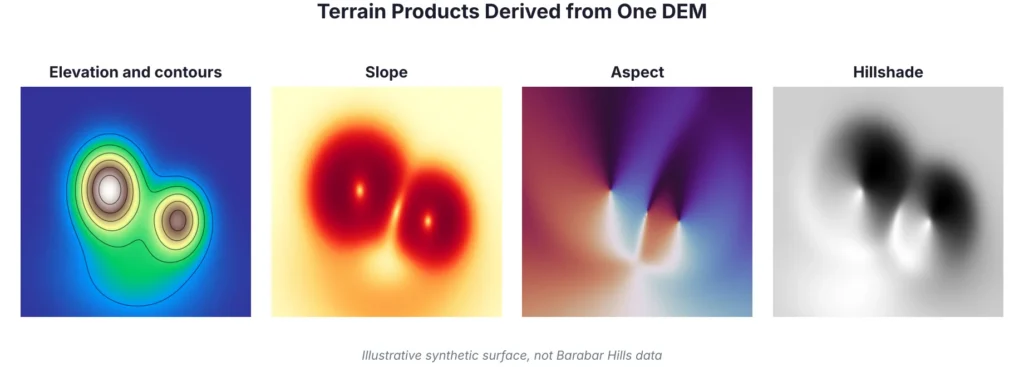
Figure 2: Elevation, slope, aspect and hillshade from one DEM (illustrative surface).
| Product | What it shows | QGIS tool (Raster menu) |
| Contours | Lines of equal elevation | Extraction, Contour |
| Slope | Steepness of each cell, in degrees | Analysis, Slope |
| Aspect | Direction each slope faces | Analysis, Aspect |
| Hillshade | Shaded relief that gives a 3D look | Analysis, Hillshade |
| Ruggedness and position | How rough or high a cell is compared with its neighbours | Analysis, Ruggedness Index and Topographic Position Index |
Once these layers exist, combine slope with topographic position to sort cells into landforms:
Summit or peak: the highest cells in their neighbourhood.
Ridge: a narrow elevated line, with high topographic position.
Steep slope or rock face: rapid change in elevation, shown by high slope values.
Gentle slope: gradual change, shown by low to moderate slope.
Valley or drainage line: a low line between higher ground.
Plain: flat, low-lying ground with very low slope.
7. Topographic Mapping of Hills: The Finished Map
Topographic mapping of hills puts the terrain layers together with features that give the map its meaning. Draw contours over a hillshade so that relief is easy to read. Add the caves and the summit temple as GPS points, then paths, steps and nearby water. Finish with a scale bar, north arrow, coordinate system, sources, date and a short note on accuracy.
8. Terrain Analysis of Barabar Hills: Questions to Ask
Where are the steepest slopes? Classify the slope map into gentle, moderate and steep.
Which way do the cave entrances face? Sample aspect values at cave points recorded by GPS.
How hard is the climb to the summit? Plot an elevation profile along the visitor route.
Where does rainwater flow? Derive flow direction and drainage lines from a filled DEM.
How accurate is the DEM? Compare DEM elevations with GPS points at known locations.
Results depend on your DEM and field data, so take measured values from your own analysis and not from this article.
9. Accuracy and Limitations
A 30 m DEM smooths small features, so steep rock faces and cave entrances may be underrepresented. Global DEMs record the surface seen by the sensor, which can include vegetation and structures. Slope and aspect also change with DEM resolution, so values from different DEMs are not directly comparable. For decisions that depend on exact heights or distances, use field points and drone data.
| Before you publish the map | |
| ☐ | DEM clipped, void-checked and reprojected (UTM zone 45N, EPSG:32645) |
| ☐ | Contours, slope, aspect and hillshade compared side by side |
| ☐ | Landform classes reviewed by someone who knows the site |
| ☐ | GPS points and photographs collected at caves and the summit |
| ☐ | Accuracy check and limitations written in the map notes |
10. Conclusion
The use of GIS-based terrain mapping transforms a hill into data that can be measured, compared and shared. The following workflow can be used to apply GIS terrain mapping techniques to the Barabar Hills, create elevation and landform maps, and then compare them to the site. It can be used on other hills and ridges, as well.
Simbi Labs supports organisations with GIS mapping and field data collection. You can read about our GIS survey services and our guide to data collection in GIS, or contact us to discuss your project.
Quick Questions and Answers
Q. What are GIS terrain mapping techniques?
A. Methods that use a DEM to produce contours, slope, aspect, hillshade and landform maps.
Q. How is elevation mapping using GIS done?
A. Prepare a DEM, then create hypsometric tints, contour lines and elevation profiles in software such as QGIS.
Q. What does landform analysis using GIS involve?
A. Calculating slope, aspect, curvature and topographic position, then classifying cells into ridges, slopes, valleys and plains.
Q. What is topographic mapping of hills?
A. Producing a map that shows hill shape with contours and shaded relief, plus paths, water and key locations.
Q. What data suits terrain analysis of Barabar Hills?
A. A 30 m global DEM for overall shape, with drone data and GPS points for caves, paths and rock faces.
Q. Which coordinate system should I use?
A. A projected system such as UTM zone 45N (EPSG:32645), so that slope is calculated in metres.
Sources
Barabar Caves (Wikipedia); The Barabar Caves, visiting Siddheshwar Peak (Mapability); NASA SRTM Digital Elevation 30m (Google Earth Engine catalog).