
Identifying Relatively Low-Lying Areas Using DEM and GIS: A Case Study of Barabar Hills
Hills make the ground around them look low, but how low is it? This case study shows how to answer that question with a digital elevation model and QGIS. It walks through low lying area mapping using GIS for the Barabar Hills in Bihar, from raw data to a finished map of low elevation zones. The article explains DEM based terrain analysis, three ways of doing elevation based lowland identification, and how to check and present the result.
| Study area | Barabar Hills and surroundings, Jehanabad district, Bihar |
| Question | Which parts of the area are relatively low compared with the hills around them? |
| Data | A digital elevation model (DEM) of about 30 m resolution, plus field GPS points for checking |
| Software | QGIS (free and open source) |
| Method | Relative elevation (TPI), an elevation threshold and sink filling, combined and cleaned |
| Output | A low elevation zone map, with area statistics and an accuracy note |
Background: The Barabar Hills Setting
The Barabar and Nagarjuni hills lie in the Makhdumpur region of Jehanabad district, about 24 km north of Gaya. They are made of granite and are best known for their Maurya-period rock-cut caves, with Nagarjuni Hill about 1.6 km from Barabar Hill. For terrain work, a cluster of hills like this is a good test. The ground between and around the hills is lower than the hills themselves, and a good method should be able to pick it out.
What Does Low-Lying Mean?
There are two ways to think about low ground. Absolute low ground means cells below a fixed elevation. Relative low ground means cells that sit lower than their neighbours, such as a valley between two hills. Figure 1 shows the second idea. A valley in high country can be higher above sea level than a hilltop in a flat region, so the choice of definition changes the answer.
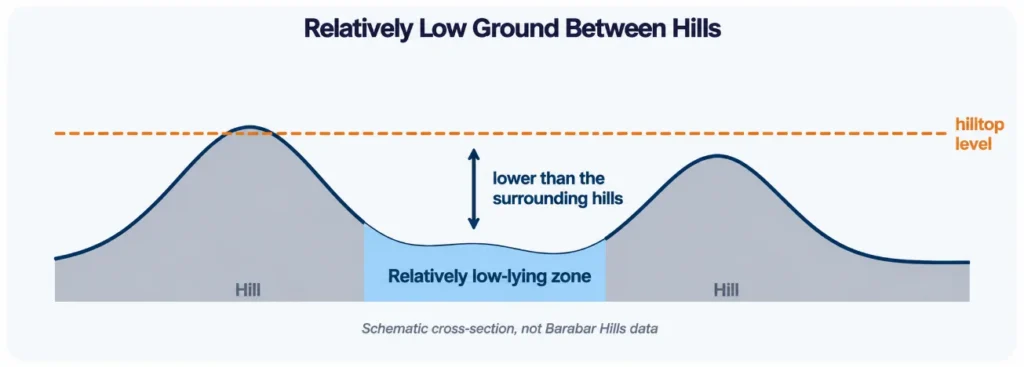
Figure 1: Low ground can be defined relative to the hills around it.
Digital Elevation Model Analysis: Choosing the Data
Digital elevation model analysis starts with the data. A DEM is a grid in which each cell stores an elevation value. Free global models with a resolution of about 30 m, such as SRTM and Copernicus GLO-30, are enough to map low zones at the scale of the whole hill group. They are not enough for detail at the scale of a path or a cave entrance, where drone data and GPS points work better.
- Resolution: a 30 m cell covers roughly 30 m by 30 m, so small features disappear.
- Surface type: global DEMs may include trees and buildings and not only bare ground.
- Vertical accuracy: check the product documentation, and compare with GPS points where possible.
- Projection: reproject to UTM zone 45N (EPSG:32645) before calculating slope or distances.
The Workflow, Stage by Stage
The table gives the full DEM based terrain analysis workflow in QGIS. Tool names can differ slightly between versions, so check the Processing Toolbox if you cannot find one.
| Stage | What you do | QGIS tool | Output |
| A. Prepare | Clip the DEM to the study area and reproject it to UTM zone 45N (EPSG:32645) | Clip raster by mask layer; Warp (reproject) | Clean DEM |
| B. Check | Look for voids, spikes and odd values | Raster layer statistics | Quality notes |
| C. Relative elevation | Compare each cell with its neighbours | Topographic Position Index | TPI raster |
| D. Threshold | Pick cells below a chosen elevation | Raster calculator; Reclassify by table | Low elevation raster |
| E. Depressions | Fill sinks and subtract the original DEM | Fill sinks tools (SAGA or GRASS, depending on install) | Depression depth raster |
| F. Combine | Keep cells that meet your rules | Raster calculator | Low zone raster |
| G. Clean and map | Remove tiny patches, convert to polygons, calculate area | Sieve; Polygonize; Zonal statistics | Low zone polygons |
Three Methods for Elevation Based Lowland Identification
No single rule defines low ground, so elevation based lowland identification works best when methods are compared and combined.
| Method | How it works | Best used for |
| Elevation threshold | Select cells below a set elevation or percentile | A quick first pass over the whole area |
| Relative elevation (TPI) | Subtract the mean of neighbouring cells from each cell; negative values are lower than surroundings | Finding low ground between hills, even at moderate heights |
| Sink filling | Fill closed depressions, then subtract the original DEM | Spotting pits and basins where water could collect |
Method 1: elevation threshold
Choose a cut-off, either a fixed height or a percentile of all cells, and select everything below it. This is fast and easy to explain, but it only finds low ground in absolute terms.
Method 2: relative elevation with TPI
The Topographic Position Index subtracts the average elevation of the cells around each cell. Negative values mean the cell is lower than its surroundings. The size of the neighbourhood matters: a small window finds small hollows, and a large window finds broad valleys.
Method 3: sink filling
Filling sinks raises closed depressions until water could flow out, and subtracting the original DEM leaves the depth of each depression. Cells with a positive depth are places where water would collect on the model surface.
Low Elevation Zone Mapping Using QGIS
Low elevation zone mapping using QGIS ends with a clean map. Figure 2 shows the idea on a synthetic surface: the DEM is turned into a relative elevation layer, and cells that are both relatively low and low in elevation are selected.
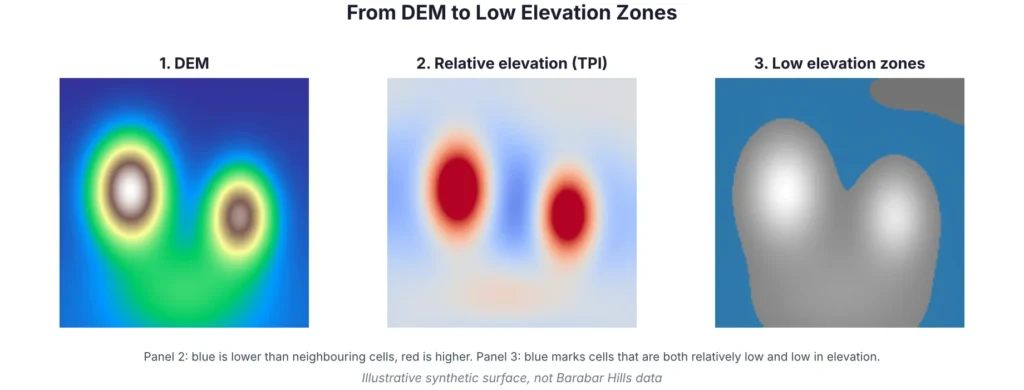
Figure 2: From DEM to low elevation zones (illustrative surface).
To finish the map, apply a sieve filter to remove isolated cells, convert the raster to polygons, and calculate the area of each zone. Style the zones in a single cool colour over a hillshade, label the DEM source and date, and add a note about the thresholds used.
Interpreting the Results
A low zone map tells you where the ground is low in the model. It does not tell you what happens there. To go further, combine it with other layers: flow direction and accumulation for drainage, land use and imagery for what is on the ground, and rainfall or field records for water behaviour.
Checking the Map
Compare the low zones with GPS points taken in the field, with high-resolution imagery, and with local knowledge. If a mapped low zone is a quarry, a road cutting or a water body, the model is showing a real feature, but one you should label. If the map misses a hollow that people know about, try a smaller TPI window or a finer DEM.
Limitations of This Approach
- A 30 m DEM cannot show small hollows, paths or cave entrances.
- Results change with the neighbourhood size and thresholds you choose.
- Global DEMs are older snapshots and may not reflect recent changes on the ground.
- Mapped zones are model results and need field checks before they are used for decisions.
| Before you share the low zone map | |
| ☐ | DEM source, date and resolution written on the map |
| ☐ | Neighbourhood size for TPI and the chosen thresholds recorded |
| ☐ | Tiny patches removed with a stated minimum size |
| ☐ | Result checked against GPS points or high-resolution imagery |
| ☐ | Notes added that low elevation does not by itself mean flood risk |
Conclusion
Low lying area mapping using GIS comes down to a clear definition, a clean DEM and a combination of methods. For the Barabar Hills, relative elevation shows the ground between and around the hills, and an elevation threshold and sink filling add detail. With field checks and honest notes on limits, the result is a map that others can understand and reuse.
Simbi Labs supports organisations with GIS mapping and field data collection. You can read about our GIS survey services and our guide to data collection in GIS, or contact us to discuss your project.
Common Questions
1.What is low lying area mapping using GIS?
It is the process of finding and mapping areas that are lower than their surroundings, using elevation data in GIS software.
2. What is DEM based terrain analysis?
It is the use of a digital elevation model to calculate terrain properties such as slope, aspect, relative elevation and depressions.
3. How does elevation based lowland identification work?
You set a rule, such as an elevation threshold, a negative TPI or a positive sink depth, and select the cells that meet it.
4. Which tools help with low elevation zone mapping using QGIS?
Raster calculator, Reclassify by table, Topographic Position Index, sink filling tools, Sieve, Polygonize and Zonal statistics.
5.Does digital elevation model analysis show flood risk?
No. It shows relative height. Flood risk also needs rainfall, drainage and land cover information.
6. What DEM resolution do I need?
About 30 m works for the whole hill group. Use drone data or GPS points for small features.
Sources
Barabar Caves (Wikipedia); NASA SRTM Digital Elevation 30m (Google Earth Engine catalog).