Environmental Remote Sensing and GIS: Applications and Benefits
The first Landsat satellite went into orbit on 23 July 1972, and satellites have been recording the land ever since. That archive now spans more than fifty years, which makes it one of the most useful records an environmental scientist can have. On its own, though, an image is only a picture. Environmental remote sensing and GIS turn it into measurements: how much forest was lost, how far a flood spread, how healthy a crop is.
This guide explains how GIS & remote sensing fit together for remote sensing and GIS for environmental studies, the data sources behind geospatial remote sensing, the main applications for environmental work, and the limits that every analyst should plan for.
Geospatial Remote Sensing: What the Sensors Record
Geospatial remote sensing means measuring the Earth from a distance, usually from a satellite, aircraft or drone. Sensors record energy reflected or emitted by the surface in different bands of light. Healthy leaves, bare soil and water all reflect those bands differently, which is why a set of bands can tell them apart. Three properties describe any sensor: its spatial detail, the number of spectral bands, and how often it returns to the same place.
| Data Source | What It Offers | Typical Environmental Use |
| Landsat 8 and 9 | Part of a programme whose first satellite launched on 23 July 1972, giving the longest continuous record of its kind; Landsat 8 and 9 together cover each part of the land every 8 days | Long-term land cover and land-use change |
| Sentinel-2 | 13 spectral bands, 10 m detail in the visible and near-infrared bands, 290 km swath and a combined revisit of about 5 days; data is free and open | Vegetation, crop, forest and inland water monitoring |
| Radar satellites | Radar signals can image the surface through cloud, so they work when optical sensors cannot | Flood extent and monitoring in cloudy seasons |
| Drone imagery | Very fine detail over small sites, collected on demand | Site-scale mapping, restoration and erosion checks |
No single source is best. Sentinel-2 gives the sharper detail and faster return, while Landsat gives the longer history, so many studies combine the two.
GIS and Remote Sensing: Where the Image Meets the Map
Remote sensing captures the surface. GIS holds everything else, such as boundaries, roads, population, soil, rainfall and field survey points, and lets an analyst combine it with the imagery. That is the core of geoinformatics and remote sensing as a field: image data and map data working on the same question. Figure 1 shows the usual path from raw image to decision.
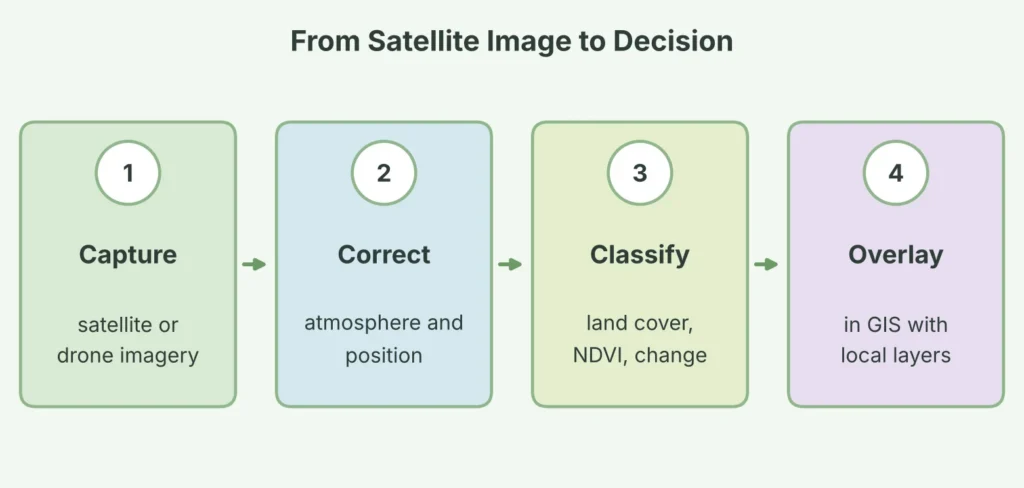
Figure 1: The four stages from raw satellite imagery to a GIS-based decision.
The correction step matters more than beginners expect. Water vapour and aerosols in the atmosphere distort the signal, and images must be aligned to the map before layers can be compared.
READ MORE: Advanced Remote Sensing And Satellite Imagery Services
Remote Sensing and GIS for Environmental Studies: Core Applications
Six applications account for most environmental work.
- Land cover and land-use change. classifying images from different years shows where forest, farmland, water and built-up land have grown or shrunk.
- Vegetation health. indices such as NDVI use red and near-infrared reflectance to flag stressed crops and forests.
- Water resources. inland and coastal water can be monitored, including harmful algal blooms, using sensors such as Sentinel-2.
- Flood and disaster mapping. imagery taken during and after an event shows how far water or damage extended.
- Forest and biodiversity monitoring. repeat images reveal clearing, degradation and recovery in protected areas.
- Urban growth and heat. land cover and surface temperature layers show where cities expand and where heat concentrates.
NDVI is the best-known of these tools. It compares near-infrared and red reflectance and returns a value between minus 1 and plus 1. Dense vegetation typically reads about 0.3 to 0.8, bare soil about 0.1 to 0.2, and water, clouds and snow read below zero, as Figure 2 shows.
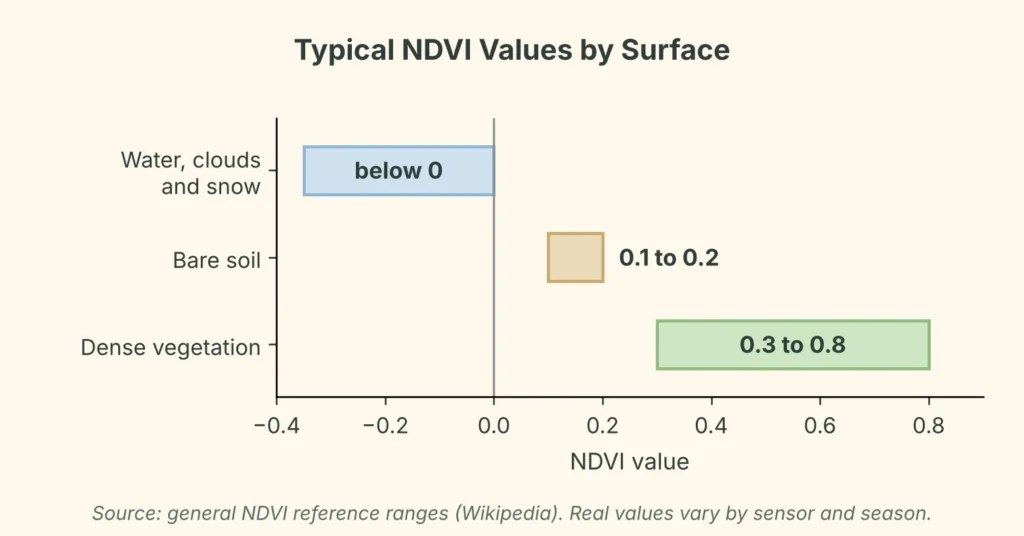
Figure 2: Typical NDVI values for common surfaces (general reference ranges; real values vary by sensor and season).
Benefits of Geoinformatics and Remote Sensing
The value lies in how the two tools answer practical questions together, as the table shows.
| Environmental Question | Remote Sensing Contributes | GIS Adds |
| Is forest cover shrinking? | Images from different dates showing cover change | Area per village or block, and links to roads and settlements |
| Is vegetation healthy? | NDVI from red and near-infrared bands | Comparison across fields, seasons and soil layers |
| Where did the flood reach? | Extent of standing water from imagery | Overlay with houses, farmland and roads to count exposure |
| Is the lake changing? | Water surface and colour signals over time | Link to catchment land use and nearby discharge points |
| Where is the city heating up? | Surface temperature from thermal bands | Join to land cover, tree cover and population |
Four wider benefits follow from this pairing.
Coverage. A single Sentinel-2 pass covers a strip 290 km wide, so large or remote areas can be assessed without a field crew in every corner.
History. Archives such as Landsat let analysts compare today’s land with its state decades ago.
Repeatability. A method applied to each new image makes monitoring consistent from season to season.
Evidence. Maps and area statistics give regulators, funders and communities a shared, checkable basis for decisions.
Limits to Plan For
Satellite analysis does not remove the need for judgement or field checks.
Cloud and timing. Optical sensors cannot see through cloud, so images from the right season may be unusable. Radar can fill gaps.
Mixed pixels. A single pixel can contain vegetation, soil and shadow together, so NDVI does not measure vegetation alone and can differ from field readings.
Atmosphere and soil moisture. Haze, water vapour and wet soil can shift index values even when vegetation has not changed.
Sensor differences. Different instruments give different NDVI values for the same target, so combining sensors needs care.
The standard answer to all four is ground truth: field points that confirm what the imagery appears to show.
A Five-Step Environmental Mapping Project
Whatever the topic, a sound project follows the same order.
- Define the question and area. write down what decision the map must support and the boundary of the study.
- Choose the imagery. match spatial detail, revisit time and season to the question, and check cloud cover.
- Prepare the data. correct for the atmosphere and align every layer to one coordinate system.
- Analyse. classify land cover, calculate indices or detect change, then bring in GIS layers.
- Validate and map. check results against field points, record accuracy and present the findings.
Simbi Labs’ GIS & Remote Sensing Support
Simbi Labs provides GIS survey and mapping services, including mapping and surveying, GPS-enabled field data collection, utility and infrastructure mapping and spatial analysis prepared for planning and decision-making. These support the ground data and GIS layers that make GIS and remote sensing work credible.
Frequently Asked Questions
1. What is environmental remote sensing and GIS?
It is the combined use of satellite or aerial imagery and a geographic information system to measure and map environmental conditions, such as land cover, vegetation health, water and flooding.
2. How is remote sensing and GIS for environmental studies carried out?
Remote sensing supplies images and indices such as NDVI. GIS overlays them with boundaries, population, soil and field data so changes can be measured, compared and mapped.
3. What is the difference between GIS and remote sensing?
Remote sensing collects information about the surface from a distance. GIS stores, analyses and presents spatial data from many sources, including remote sensing. Most environmental projects use both.
4. What does geoinformatics and remote sensing cover?
Geoinformatics is the science of managing and analysing spatial information. Together with remote sensing it spans data capture, processing, analysis and mapping.
5. Which satellites are used for geospatial remote sensing?
Landsat 8 and 9 and Sentinel-2 are widely used, with radar satellites for cloudy conditions and drones for small sites. Landsat offers the longer record and Sentinel-2 the finer detail and quicker return.
6. What are the limits of GIS and remote sensing?
Cloud cover, mixed pixels, atmospheric effects and sensor differences can affect results, so projects need corrections and field validation.