
Multivariate Statistical Data Analysis: A Comprehensive Guide

In today’s data-driven world, researchers and businesses rarely deal with a single variable in isolation. Most real-world problems involve multiple factors interacting simultaneously. Whether you are studying patient outcomes, customer behavior, employee performance, or market trends, understanding the relationships among several variables is crucial. This is where Multivariate Analysis becomes one of the most powerful tools in statistics and data science.
Multivariate analysis enables researchers to examine multiple variables simultaneously, uncover hidden patterns, make accurate predictions, and derive meaningful insights from complex datasets. In this comprehensive guide, we explain what multivariate analysis is, its types, applications, assumptions, and how it is used in modern research.
What is Multivariate Analysis?
Multivariate Analysis (MVA) refers to a collection of statistical techniques used to analyze datasets that contain more than one variable. Unlike univariate analysis, which focuses on a single variable, or bivariate analysis, which examines relationships between two variables, multivariate analysis investigates the relationships among multiple variables simultaneously.
The primary objective of multivariate analysis is to understand how several independent variables influence one or more dependent variables while accounting for their interrelationships.
For example, a researcher studying student performance may examine the combined effects of study hours, attendance, socioeconomic status, and parental education on academic achievement rather than analyzing each factor separately.
Why is Multivariate Analysis Important?
Modern research questions are often complex and cannot be answered using simple statistical methods. Multivariate analysis helps researchers:
- Analyze multiple variables simultaneously
- Identify key factors influencing outcomes
- Reduce data complexity
- Improve prediction accuracy
- Control for confounding variables
- Discover hidden relationships within data
- Support evidence-based decision-making
Because of these advantages, multivariate techniques are widely used in healthcare, business analytics, psychology, economics, engineering, and social sciences.
Types of Statistical Analysis
Before understanding multivariate analysis, it is useful to distinguish it from other forms of statistical analysis.
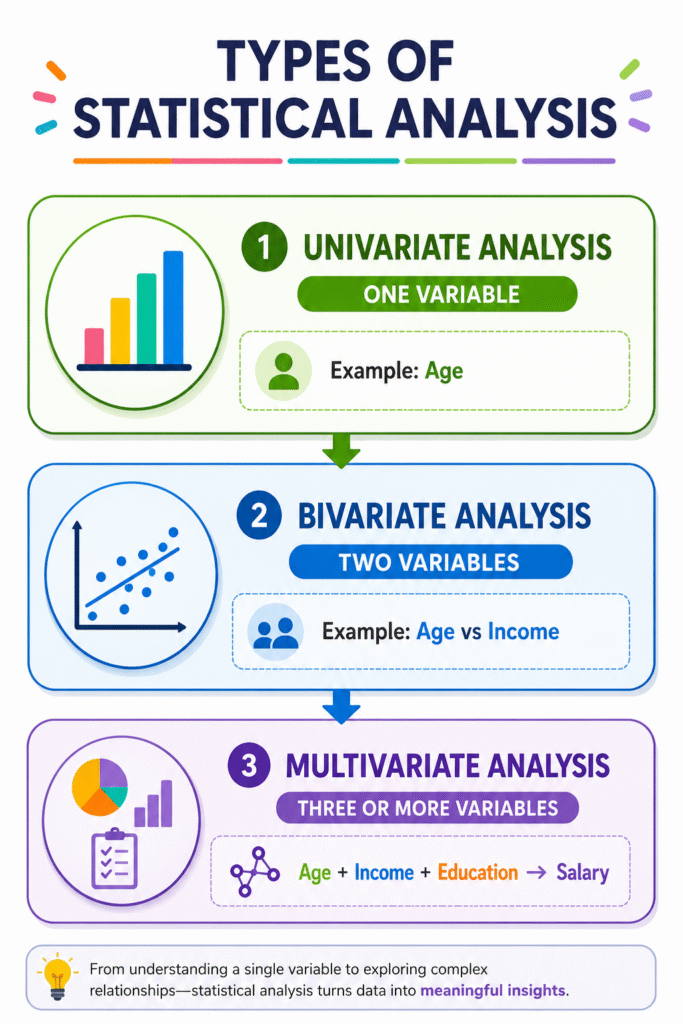
| Analysis Type | Number of Variables |
| Univariate Analysis | One Variable |
| Bivariate Analysis | Two Variables |
| Multivariate Analysis | Three or More Variables |
Example
Univariate Analysis
- Mean age of respondents
Bivariate Analysis
- Relationship between age and income
Multivariate Analysis
- Effect of age, education, experience, and gender on income
Common Multivariate Analysis Techniques
Several statistical methods fall under the category of multivariate analysis.
1. Multiple Linear Regression
Multiple Linear Regression is one of the most widely used multivariate statistical techniques for examining the relationship between a single continuous dependent variable and multiple independent variables. It helps researchers understand how various predictors collectively influence an outcome and identify the most important factors contributing to that outcome.
Example: A researcher wants to predict employee salary based on education level, years of experience, age, and job performance score. In this case, salary is the dependent variable, while the remaining variables act as independent predictors.
Data Requirements: The dependent variable should be continuous (e.g., salary, blood pressure, test score), while independent variables can be continuous or categorical (after appropriate coding).
Key Assumptions: The model assumes linear relationships between variables, independence of observations, normality of residuals, homoscedasticity (constant variance of errors), and absence of multicollinearity among predictors.
Applications: Business forecasting, healthcare research, educational studies, economic analysis, and social science research.
SPSS Procedure for Multiple Linear Regression
To perform Multiple Linear Regression in SPSS, go to Analyze → Regression → Linear. Move the dependent variable (e.g., Salary) into the Dependent box and move the independent variables (e.g., Education Level, Years of Experience, Age, and Job Performance Score) into the Independent(s) box. Click Statistics and select Estimates, Model Fit, Collinearity Diagnostics, and Confidence Intervals. Then click Continue and OK to run the analysis.
2. Logistic Regression
Logistic Regression is a multivariate statistical technique used when the dependent variable is categorical, most commonly binary (e.g., Yes/No, Success/Failure, Diseased/Healthy). It estimates the probability of an event occurring based on one or more independent variables and helps identify significant risk factors associated with the outcome.
Example: A researcher wants to predict whether a patient has diabetes based on age, BMI, blood pressure, and family history. The outcome variable is coded as Yes (1) for diabetic and No (0) for non-diabetic.
Data Requirements: The dependent variable should be binary, while independent variables can be continuous, ordinal, or categorical.
Key Assumptions: Independent observations, absence of multicollinearity, linear relationship between continuous predictors and the logit of the outcome, and adequate sample size.
Applications: Medical diagnosis, disease risk prediction, customer churn analysis, credit risk assessment, and marketing analytics.
SPSS Procedure for Logistic Regression
To perform Logistic Regression in SPSS, go to Analyze → Regression → Binary Logistic. Move the binary outcome variable (e.g., Diabetes Status) into the Dependent box and the predictor variables (e.g., Age, BMI, Blood Pressure, and Family History) into the Covariates box. Click Options if required and then click OK to run the analysis.
3. MANOVA (Multivariate Analysis of Variance)
MANOVA is an extension of ANOVA that allows researchers to compare group differences across multiple dependent variables simultaneously. Instead of conducting separate ANOVA tests for each outcome, MANOVA evaluates all dependent variables together, providing a more comprehensive understanding of group effects.
Example: A researcher compares three teaching methods based on students’ Mathematics, Science, and Language scores. MANOVA determines whether the teaching methods differ significantly across the combined academic outcomes.
Data Requirements: One or more categorical independent variables and two or more continuous dependent variables.
Key Assumptions: Multivariate normality, independence of observations, absence of multicollinearity among dependent variables, and homogeneity of covariance matrices.
Advantages: Reduces Type I error and examines overall group differences more effectively.
SPSS Procedure for MANOVA
Go to Analyze → General Linear Model → Multivariate. Move the dependent variables (e.g., Mathematics, Science, and Language scores) into the Dependent Variables box and the grouping variable (e.g., Teaching Method) into the Fixed Factor(s) box. Click Options, select descriptive statistics and homogeneity tests if required, then click OK.
4. Factor Analysis
Factor Analysis is a dimensionality reduction technique used to identify underlying factors that explain the relationships among a large number of observed variables. It helps researchers simplify complex datasets and uncover latent constructs that may not be directly measurable.
Example: A questionnaire contains 25 items related to job satisfaction, work environment, motivation, and leadership. Factor analysis may identify a smaller number of underlying factors representing these dimensions.
Data Requirements: Multiple correlated continuous or ordinal variables with an adequate sample size.
Key Assumptions: Sufficient correlations among variables, adequate sample size, linear relationships, and absence of extreme multicollinearity.
Applications: Scale development, questionnaire validation, psychometric studies, and survey research.
SPSS Procedure for Factor Analysis
Go to Analyze → Dimension Reduction → Factor. Move all relevant variables into the Variables box. Under Extraction, select the extraction method (e.g., Principal Component Analysis) and choose the number of factors if desired. Under Rotation, select a rotation method such as Varimax. Click OK to perform the analysis.
5. Principal Component Analysis (PCA)
Principal Component Analysis (PCA) is a data reduction technique used to transform a large set of correlated variables into a smaller number of uncorrelated components while retaining most of the original information. It helps simplify complex datasets and improve interpretability.
Example: A marketing dataset contains variables such as purchase frequency, spending habits, product preferences, and brand loyalty. PCA can reduce these variables into a few principal components representing customer behavior patterns.
Data Requirements: Multiple continuous variables with meaningful correlations.
Key Assumptions: Linear relationships among variables, adequate sample size, and sufficient correlations between variables.
Applications: Data reduction, exploratory data analysis, machine learning, and market research.
SPSS Procedure for PCA
Go to Analyze → Dimension Reduction → Factor. Move the variables into the Variables box. Under Extraction, select Principal Components and choose the desired number of components. Optionally select Varimax Rotation for easier interpretation, then click OK.
6. Discriminant Analysis
Discriminant Analysis is a classification technique used to predict group membership based on one or more predictor variables. It identifies the variables that best distinguish between predefined groups and develops functions for classifying future observations.
Example: A company wants to classify customers into high-value, medium-value, and low-value categories based on spending behavior, income, and demographic characteristics.
Data Requirements: One categorical dependent variable with two or more groups and multiple continuous predictor variables.
Key Assumptions: Multivariate normality, independence of observations, absence of multicollinearity, and equality of covariance matrices across groups.
Applications: Customer classification, credit risk assessment, medical diagnosis, and employee performance evaluation.
SPSS Procedure for Discriminant Analysis
Go to Analyze → Classify → Discriminant. Move the categorical grouping variable into the Grouping Variable box and define the group ranges. Move the predictor variables into the Independents box and click OK to perform the analysis.
7. Cluster Analysis
Cluster Analysis is an unsupervised statistical technique used to group similar observations into clusters based on their characteristics. Unlike classification methods, cluster analysis does not require predefined groups and is useful for identifying hidden patterns within data.
Example: A company segments customers into groups based on age, income, and purchasing behavior to develop targeted marketing strategies.
Data Requirements: Continuous or categorical variables describing the observations to be clustered.
Key Assumptions: Meaningful similarity measures, absence of extreme outliers, and variables measured on comparable scales.
Applications: Market segmentation, customer profiling, image recognition, pattern detection, and business analytics.
SPSS Procedure for Cluster Analysis
Go to Analyze → Classify → Hierarchical Cluster (or K-Means Cluster). Move the clustering variables into the Variables box, choose the clustering method and distance measure, then click OK to generate clusters.
Advantages of Multivariate Analysis
- Examines multiple variables simultaneously
- Improves prediction accuracy
- Controls confounding factors
- Provides comprehensive insights
- Supports evidence-based decisions
- Handles complex research questions
Limitations of Multivariate Analysis
- Requires larger sample sizes
- More complex interpretation
- Sensitive to assumption violations
- Can be affected by multicollinearity
Proper data preparation and statistical expertise are essential for obtaining reliable results.
How to Choose the Right Multivariate Technique
| Research Objective | Recommended Technique |
| Predict continuous outcome | Multiple Regression |
| Predict binary outcome | Logistic Regression |
| Compare groups on multiple outcomes | MANOVA |
| Reduce variables | PCA |
| Identify underlying dimensions | Factor Analysis |
| Classify observations | Discriminant Analysis |
| Group similar cases | Cluster Analysis |
Conclusion
Multivariate analysis is an essential statistical approach for modern research and data analytics. By analyzing multiple variables simultaneously, researchers can uncover deeper insights, improve predictive accuracy, and make more informed decisions.
Whether you are conducting healthcare research, business analytics, educational studies, or social science investigations, multivariate analysis provides the tools needed to understand complex relationships within data.
At our data analysis and statistical consulting company, we provide expert support for:
- SPSS Data Analysis
- Multivariate Statistical Analysis
- Regression Modeling
- MANOVA
- Factor Analysis
- Logistic Regression
- Thesis and Dissertation Statistics
- Research Methodology
- Data Visualization and Reporting
Our team helps researchers, PhD scholars, healthcare professionals, and businesses transform raw data into meaningful insights through advanced statistical techniques.
Book a free consultation for appointment
Email us at : grow@simbi.in
For an in-depth understanding, please refer to our book, “Academic Research Fundamentals: Research Writing and Data Analysis”. It is available as an eBook here, or you may purchase the hardcopy here .