
Statistical Data Analysis in Business: Methods, Applications, Benefits & Real-World Examples

All businesses gather data, whether it be regarding their customer purchases, the number of visitors to their website, the results of their marketing campaigns, or financial transactions. But if data is not analyzed well, it has little value. By transforming raw data into actionable insights, statistical data analysis empowers businesses to gain a deeper understanding of their data, make informed decisions, minimize uncertainty, optimize operations, and drive sustainable growth. In today’s data-driven economy, companies who make use of statistical analysis get a great competitive side over those who rely simply on instinct.
What is Statistical Data Analysis in Business?
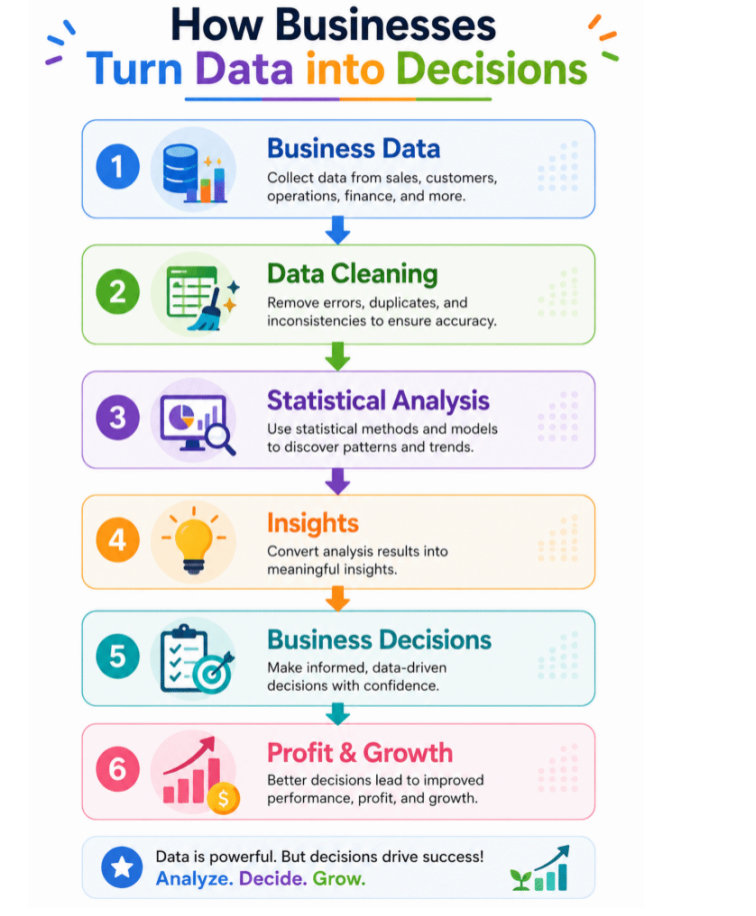
Statistical Data Analysis consists of data collection, organization, analysis, interpretation and presentation to support business decision making. It relies on statistical techniques to identify patterns, relationships and trends in data. Businesses make decisions based on statistical analysis, which helps them optimize efficiency, minimize risk, and boost their profits, rather than relying on assumptions or intuition.
The analysis of data from sources like sales records, customer feedback, financial reports, marketing campaigns and operational processes can help organisations to gain better insights into their performance and identify areas for improvement.
Why Statistical Analysis is Important in Business
Businesses have to function in a volatile world where customers, market dynamics and competition are constantly evolving. When uncertainty is reduced, it is done with the help of statistical analysis, which gives objective evidence.
Benefits of Statistical Analysis
1.Enhances Decision-Making: This is because statistical analysis gives accurate information that is based on data to support businesses in making decisions.
2. It identifies Business Opportunities: It can detect trends and patterns that show new opportunities for growth and innovation.
3. Minimises Operational Risks by providing business with reliable data and evidence to support decision making.
4. Improves Customer Satisfaction: It helps the organisations understand the need of the customer and improve their products and services.
5. Facilitates Strategic Planning: It offers important insights which enable businesses to establish realistic objectives and devise effective strategies.
6. Maximizes Resource Allocation: It helps to optimize time, budget and resources for the organization.
7. Enhances Profitability: Facilitates improved business decision making to increase efficiency, minimise costs and maximise profits.
Practical Applications of Statistical Analysis in Business
1.Sales Data Analysis: With sales performance analysis, businesses can gain insights into the trends in sales and find growth opportunities.
2.Customer Satisfaction Analysis: Customer satisfaction has direct impact on customer loyalty and profitability.
3. Market Research and Consumer Behavior: This is the understanding of the preferences of consumers that is necessary for the success of a business.
4. Human Resource Analytics: HR teams are increasingly leveraging statistical techniques to enhance the management of their workforce.
5. Financial Analysis and Risk Management: Financial data analysis is useful for businesses to track their profitability and manage risks.
6. Supply Chain Optimization: This includes efficient inventory and supply chain management, which are essential for profitability.
Common Statistical Techniques Used in Business
| Statistical Method | Business Application |
| Descriptive Statistics | Summarizing business data |
| Correlation Analysis | Identifying relationships |
| Regression Analysis | Predicting outcomes |
| T-Test | Comparing two groups |
| ANOVA | Comparing multiple groups |
| Chi-Square Test | Association between categories |
| Time Series Analysis | Sales forecasting |
| Cluster Analysis | Customer segmentation |
| Factor Analysis | Market research |
| Logistic Regression | Risk prediction |
Case Study: Sales Forecasting in Retail
A retail company wanted to forecast sales for the upcoming quarter to improve inventory planning. It analyzed historical data, including monthly sales, advertising expenditure, seasonal trends, and economic indicators.
Using Time Series Analysis, the company predicted future sales and adjusted inventory levels to match expected demand.
Business Impact
- Improved inventory management
- Reduced operational costs
- Increased customer satisfaction
- Better business planning through data-driven decisions
Real-Life Example:
Netflix Recommends Personalized Content
Netflix analyzes viewing history, watch time, ratings, and user preferences using statistical models to recommend movies and TV shows. This personalized recommendation system keeps users engaged, improves customer satisfaction, and increases subscription retention.
Business Impact
- Better customer experience
- Higher user engagement
- Increased customer retention
Amazon Improves Customer Experience
Amazon uses statistical data analysis to study customer browsing behavior, purchase history, product ratings, and search patterns. These insights help the company recommend products, forecast demand, optimize warehouse inventory, and improve delivery efficiency.
Business Impact
- Personalized product recommendations
- Better demand forecasting
- Faster deliveries
- Increased sales and customer satisfaction
Software Used for Statistical Business Analysis
Modern businesses use various statistical software tools.
Popular Software
- SPSS
- R Programming
- Python
- Excel
- Power BI
- Tableau
- SAS
- Stata
Challenges in Business Data Analysis
Although statistical analysis provides tremendous value, businesses often face challenges such as:
- Poor data quality
- Missing information
- Small sample sizes
- Data privacy concerns
- Lack of analytical expertise
Future of Statistical Analysis in Business
It is used by companies to make educated guesses on future trends, to grasp customers’ attitudes and behaviours, to make quicker decisions, to create more effective marketing plans, and to acquire valuable business insights. Through statistical analysis, companies can adapt to market trends, enhance their operations, and secure sustainable growth.
Conclusion:
The use of statistical data analysis is now a critical component in making business decisions. It transforms raw data into valuable insights, enabling organizations to gain an understanding of customer behavior, optimize operations, predict trends, and minimize risks. Whether it’s sales forecasting, market research, or financial planning and human resource management, statistical analysis enables informed and better decision-making in all aspects of business. With the increasing amount of data businesses are dealing with, statistical analysis will play an increasingly pivotal role in boosting efficiency, maintaining competitiveness, and achieving long-term success.
Schedule a free consultation today.
For inquiries, contact us at: grow@simbi.in