
Top Statistical Methods For Analyzing Data: A Comprehensive Guide with Examples and Best Practices
safe for the larger patient population, justifying its potential approval and widespread use.In today’s data-driven world, organizations, researchers, healthcare professionals, and businesses generate massive amounts of data every day. However, data alone has little value unless it is properly analyzed and interpreted. This is where Statistical Data Analysis Methods play a crucial role.
Statistical analysis transforms raw data into meaningful insights, helping researchers test hypotheses, identify patterns, predict future outcomes, and make informed decisions. Whether you are conducting academic research, evaluating business performance, analyzing healthcare outcomes, or performing market research, selecting the right statistical method is essential for obtaining reliable results.
In this guide, we explore the most important statistical data analysis methods, their applications, practical examples, and best practices for effective analysis.
What is Statistical Data Analysis?
Statistical Data Analysis is the process of collecting, organizing, summarizing, interpreting, and presenting data using statistical techniques. The primary goal is to extract useful information from data and support evidence-based decision-making.
Statistical analysis helps answer questions such as:
- What trends exist in the data?
- Are differences between groups statistically significant?
- What factors influence a particular outcome?
- Can future outcomes be predicted?
- Are variables related to each other?
By answering these questions, statistical methods help organizations and researchers make informed decisions.
Why Statistical Data Analysis is Important
Statistical analysis provides a systematic approach for understanding data and reducing uncertainty.
Benefits of Statistical Analysis
- Supports evidence-based decision-making
- Identifies trends and patterns
- Tests research hypotheses
- Predicts future outcomes
- Measures relationships among variables
- Improves business and research outcomes
- Enhances data-driven strategies
Without proper statistical analysis, decision-making often relies on assumptions rather than evidence.
Types of Statistical Data Analysis
Statistical analysis methods are broadly classified into four categories:
| Analysis Type | Purpose |
| Descriptive Analysis | Summarize and describe data |
| Inferential Analysis | Draw conclusions about populations |
| Predictive Analysis | Forecast future outcomes |
| Exploratory Analysis | Discover patterns and relationships |
1. Descriptive Statistics
Descriptive statistics summarize and present data in a meaningful way. They provide an overview of the dataset without making predictions or testing hypotheses.
Common Measures
Measures of Central Tendency
- Mean
- Median
- Mode
Measures of Dispersion
- Standard Deviation
- Variance
- Range
- Interquartile Range
Example
A researcher analyzes exam scores of 100 students and finds:
- Mean Score = 75
- Median Score = 74
- Standard Deviation = 8
These statistics provide a quick summary of student performance.
2. Correlation Analysis
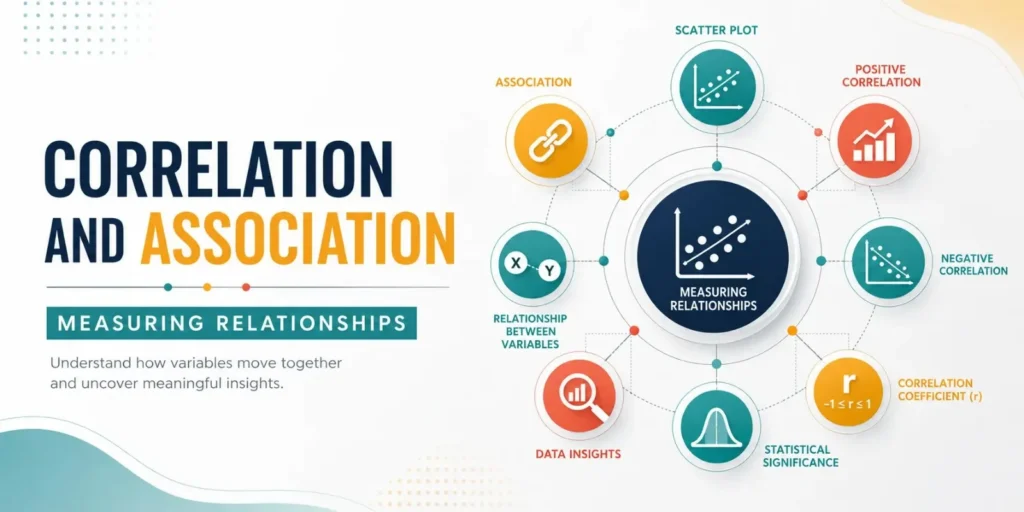
Correlation analysis measures the strength and direction of the relationship between two variables.
Example
A researcher wants to determine whether study hours influence exam scores.
Variables:
- Study Hours
- Exam Scores
The analysis may reveal a strong positive correlation, indicating that students who study more tend to achieve higher scores.
Types of Correlation
- Pearson Correlation
- Spearman Correlation
- Kendall’s Tau
3. Regression Analysis
Regression analysis examines how one or more independent variables influence a dependent variable.
Example
A company wants to predict employee salary based on:
- Education Level
- Experience
- Age
- Performance Score
Salary becomes the dependent variable, while the remaining variables serve as predictors.
Types of Regression
- Simple Linear Regression
- Multiple Linear Regression
- Logistic Regression
4. Hypothesis Testing
Hypothesis testing helps researchers determine whether observed differences or relationships are statistically significant.
Basic Steps
- Formulate hypotheses
- Select significance level
- Perform statistical test
- Interpret p-value
- Draw conclusions
Example
A researcher wants to determine whether a new teaching method improves student performance.
5. T-Tests
T-tests compare means between groups.
Used when comparing two independent groups.
Example
Comparing exam scores between:
- Male students
- Female students
Used when comparing measurements from the same individuals.
Example
Comparing:
- Pre-test scores
- Post-test scores
after a training program.
6. Analysis of Variance (ANOVA)
ANOVA compares means across three or more groups simultaneously.
Example
A researcher compares student performance across:
- Traditional teaching
- Online learning
- Hybrid learning
Instead of performing multiple t-tests, ANOVA evaluates all groups together.
Types
- One-Way ANOVA
- Two-Way ANOVA
- Repeated Measures ANOVA
7. Chi-Square Test
The Chi-Square Test evaluates relationships between categorical variables.
Example
A company examines whether customer satisfaction differs by gender.
Variables:
- Gender
- Satisfaction Level
The Chi-Square Test determines whether an association exists between these variables.
8. Factor Analysis
Factor Analysis reduces a large number of variables into a smaller set of underlying factors.
Example
A customer satisfaction survey contains 25 questions related to:
- Service Quality
- Product Quality
- Pricing
- Customer Support
Factor analysis identifies broader dimensions that explain the responses.
9. Principal Component Analysis (PCA)
PCA is used to simplify complex datasets while retaining most of the original information.
Example
A retailer analyzes:
- Spending Habits
- Purchase Frequency
- Product Preferences
- Loyalty Indicators
PCA reduces these variables into fewer components for easier interpretation.
10. Cluster Analysis
Cluster Analysis groups similar observations together based on their characteristics.
Example
An e-commerce company segments customers based on:
- Age
- Income
- Shopping Behavior
The analysis identifies customer groups that can be targeted with different marketing strategies.
Choosing the Right Statistical Method
Selecting the appropriate statistical technique depends on:
Research Objective
- Describe data → Descriptive Statistics
- Compare groups → T-Test or ANOVA
- Study relationships → Correlation
- Predict outcomes → Regression
- Classify observations → Cluster Analysis
Data Type
| Data Type | Recommended Methods |
| Continuous | T-Test, ANOVA, Regression |
| Categorical | Chi-Square Test |
| Multiple Variables | Factor Analysis, PCA |
Best Practices for Statistical Data Analysis
1. Understand Your Data
Always examine:
- Data type
- Variable structure
- Missing values
- Outliers
before selecting statistical methods.
2. Verify Assumptions
Most statistical tests require assumptions such as:
- Normality
- Independence
- Homogeneity of variance
- Linearity
Failure to verify assumptions can lead to incorrect conclusions.
3. Use Appropriate Sample Sizes
Larger sample sizes generally provide more reliable and stable results.
4. Visualize Data
Use:
- Histograms
- Boxplots
- Scatterplots
- Bar Charts
to better understand your data.
5. Report Results Transparently
Include:
- Test statistics
- P-values
- Confidence intervals
- Effect sizes
for comprehensive reporting.
Software Used for Statistical Data Analysis
Researchers and analysts commonly use:
- SPSS
- R Programming
- Python
- SAS
- Stata
- Excel
- Power BI
SPSS remains one of the most popular tools for academic and professional statistical analysis because of its user-friendly interface and extensive analytical capabilities.
Conclusion
Statistical Data Analysis Methods form the foundation of modern research, business intelligence, healthcare analytics, and evidence-based decision-making. From descriptive statistics and hypothesis testing to advanced techniques such as regression, factor analysis, and cluster analysis, each method serves a unique purpose in extracting meaningful insights from data.
The key to successful analysis lies in understanding your research objective, selecting the appropriate statistical method, verifying assumptions, and interpreting results correctly. By applying the right techniques, researchers and organizations can transform raw data into actionable knowledge that drives innovation, improves performance, and supports informed decision-making.
👉 Contact Simbi Labs today to schedule a free consultation and start your data transformation journey!
For an in-depth understanding, please refer to our book, “Academic Research Fundamentals: Research Writing and Data Analysis”. It is available as an eBook here, or you may purchase the hardcopy here .
Statistical Methods Quiz