
Statistical Techniques in Market Research

Market research is more than collecting survey responses or sales data. The real value lies in analyzing information with the right statistical techniques in market research. These techniques uncover patterns, test assumptions, and help businesses make confident decisions. At Simbi Labs of India, we apply market research statistical methods systematically to turn raw data into actionable insights through advanced market research data analysis for smarter business strategies.. Below are some of the most important statistical methods, explained with simple examples
Why a Graph Is a Visual Representation of Data in Market Research.
A graph is a visual representation of data that helps businesses and researchers understand complex information quickly and accurately. In market research, graphs simplify large datasets by presenting trends, comparisons, and customer behavior patterns in an easy-to-read format. Bar graphs, pie charts, line graphs, and histograms are commonly used to analyse survey results, sales performance, and market trends. Using graphs in statistical analysis improves decision-making, data interpretation, and reporting efficiency. Visual data representation also helps identify opportunities, predict customer preferences, and communicate insights more effectively. This makes graphs an essential part of statistical techniques in modern market research and business analysis.
1. Descriptive Statistics – Summarizing Data
Descriptive statistics are fundamental statistical techniques in market research which provide the foundation for any market study. They include measures like mean, median, percentages, and frequency counts Using market research statistical methods, you can quickly perform market research data analysis to understand distributions, central tendencies, and spreads without complex modeling.
Explanation: They give a quick overview of consumer behavior without going into complex analysis.
When to use: First look at any dataset—understand distributions, central tendency, and spread.
Data needed: Any numeric or categorical survey/transaction fields (e.g., age, spend, product, city).
Steps of implementation
1. Define the question: “What does our customer base look like?”
2. Audit data: Check sample size, duplicates, missing values, outliers.
3. Classify variables: Numeric (e.g., spend), categorical (e.g., brand).
4. Summarize:
Numeric → mean, median, min/max, SD, percentiles.
Categorical → frequencies and % share.
5. Visualize: Histograms, bar charts, box plots.
6. Segment summaries: Repeat by key cuts (region, age group, channel).
7. Interpret: Call out patterns (skewed spend, top categories, long tails).
8. Deliverables: One-page dashboard with KPIs, top 5 lists, and charts.
Example: “Average monthly basket ₹1,250; top 3 items = milk (22%), bread (18%), eggs (12%). North region median basket is 15% higher.”
2. Cross-Tabulation – Comparing Groups
Cross-tabulation is a key statistical technique in market research shows the relationship between two or more variables. Using market research statistical methods, analysts can perform market research data analysis to reveal how different customer segments behave and which groups over- or under-index on certain metrics.
Explanation: It helps identify how different customer segments behave.
When to use: See how two (or more) categorical variables relate.
Data needed: Two categorical fields (e.g., age group × preferred channel).
Steps of implementation
1. Pick variables: e.g., Age Group (18–24/25–34/35+) × Buying Channel (Online/Offline).
2. Create the table: Counts and row/column percentages.
3. Add totals & percentages: Row % answer “within age, what channel?”
4. Statistical test: Chi-square for association; inspect residuals to see which cells drive significance.
5. Visualize: Stacked bars or heatmap.
6. Interpret: Identify segments with over/under-indexing.
7. Deliverables: Cross-tab, chi-square result, “so-what” bullets.
Example: “Age 18–24 over-indexes on Online (78% vs 60% overall), χ² p<0.01 → target digital offers to 18–24.”
3. Regression Analysis – Understanding Cause and Effect
Regression analysis is an essential statistical technique in market research which examines how multiple factors influence an outcome. With market research statistical methods, businesses can carry out market research data analysis to determine how factors like price, promotions, or footfall influence outcomes such as sales or conversions.
Explanation: It highlights which variables are most important in predicting customer behavior.
When to use: Quantify how predictors influence an outcome (sales, NPS, conversion).
Data needed: One dependent variable + candidate predictors (price, promo, visits, ratings).
Steps of implementation
1. Define DV & scope: e.g., Weekly Sales per store.
2. Assemble predictors: Price, discount, footfall, shelf share, region dummies, seasonality dummies.
3. Prepare data: Handle missing, encode categories, scale if needed, remove collinearity (VIF check).
4. Split data: Train/validation (e.g., 70/30).
5. Fit model: Linear/GLM; consider interactions (price×promo).
6. Check diagnostics: R²/Adj-R², residual plots, VIF, outliers/influence.
7. Validate: RMSE/MAE on holdout; cross-validate if possible.
8. Interpret: Coefficients (direction, magnitude), elasticity, significant drivers.
9. Scenario test: Simulate “+10% promo budget” or “−5% price”.
10. Deliverables: Driver chart, coefficient table, forecast/simulator file.
Example: “A 1% price cut lifts sales by 0.8% (p<0.01); digital ads ROI > TV; prioritize price promotions + digital.”
4. Factor Analysis – Reducing Complexity
Factor analysis is an advanced statistical technique in market research useful when dealing with large sets of survey questions. Using market research statistical methods, analysts perform market research data analysis to condense multiple attitudinal items into fewer factors for easier interpretation and downstream modeling.
Explanation: It groups related items into underlying “factors,” making the data easier to interpret.
When to use: Collapse 10–30 attitudinal items into a few latent factors.
Data needed: Likert-scale items measuring perceptions (quality, ease, trust, etc.).
Steps of implementation
1. Item screening: Adequate variability, consistent scales, reverse-code where needed.
2. Suitability tests: KMO > 0.7, Bartlett’s p<0.05.
3. Extraction: Use PCA or common factor; decide #factors (eigenvalues>1, scree plot, parallel analysis).
4. Rotation: Varimax (orthogonal) or Promax (oblique) for interpretable loadings.
5. Name factors: Use items with loadings ≥0.40 and logical meaning.
6. Compute scores: Factor scores for each respondent.
7. Reliability: Cronbach’s α ≥0.70 for item groups.
8. Use downstream: Feed factor scores into clustering or regression.
9. Deliverables: Loading matrix, factor names, reliability table, score distributions.
Example: 18 items collapse into 3 factors—“Product Reliability,” “Service Responsiveness,” “Brand Trust.”
5. Cluster Analysis – Customer Segmentation
Cluster analysis is a powerful statistical technique in market research which divides customers into groups based on similarities in behavior or preferences.
Explanation: Through market research statistical methods, market research data analysis it helps businesses create targeted marketing strategies.
When to use: Group customers by similar needs/behavior.
Data needed: Behavioral/attitudinal/factor scores; avoid purely demographic-only clustering.
Steps of implementation
1. Choose inputs: Stable, action-worthy variables (e.g., spend frequency, discount sensitivity, ‘Brand Trust’ factor).
2. Preprocess: Standardize/scale; winsorize outliers.
3. Decide algorithm: K-means for speed; hierarchical for structure; GMM for probabilistic clusters.
4. Pick K: Elbow, silhouette, gap statistic; also prefer business-meaningful sizes.
5. Run model & replicate: Multiple random starts to ensure stability.
6. Profile clusters: Means, proportions, demographics, value; name segments.
7. Validate: Stability across samples/time; external criteria (conversion, NPS).
8. Assign rules: Scoring logic for new customers.
9. Activation plan: Offers, channels, product bundles per segment.
10. Deliverables: Segment personas, sizing, value, targeting playbook.
Example segments: “Deal Seekers,” “Convenience Maxis,” “Premium Loyalists.”
6. Conjoint Analysis – Understanding Customer Choices
Conjoint analysis is a critical statistical technique in market research which shows how customers value different product features.
Read Also : Choice-Based Conjoint Made Simple: From Design to Hierarchical Bayes Estimation
Explanation: By presenting combinations of product features, applying market research statistical methods, analysts perform market research data analysis it reveals what trade-offs customers are willing to make.
When to use: Design/pricing; learn attribute importance and part-worths.
Data needed: Attributes (e.g., battery, camera, warranty) with discrete levels + price levels.
Steps of implementation
1. Define objective: Optimize feature-price mix for target market.
2. Pick attributes/levels: 4–6 attributes; realistic level ranges.
3. Design tasks: Choice-based conjoint (CBC) with efficient experimental design.
4. Program survey: Randomize tasks, include warm-up/consistency checks.
5. Collect sample: Adequate size (often 200–800) across key segments.
6. Estimate model: Hierarchical Bayes or MNL to get part-worth utilities.
7. Compute importance: Range of utilities per attribute.
8. Simulate markets: Build choice simulator to compare product concepts and price points.
9. Optimize: Identify max-share or max-profit configuration under constraints.
10. Deliverables: Part-worths, attribute importance, share/price elasticity simulator.
Example: Battery life accounts for 38% importance; raising warranty from 1→2 years lifts share +4 pts at ₹X price.
7. Hypothesis Testing – Checking Assumptions
Hypothesis testing is a fundamental statistical technique in market research that validates whether observed differences are real or random.
Explanation: It provides statistical confidence when comparing groups or strategies.
When to use: A/B tests, pre-post comparisons, group differences.
Data needed: Outcome metric(s) per variant or group.
Steps of implementation
1. State hypotheses: H0 (no difference), H1 (difference/effect direction).
2. Pick test & α:
t-test (two means), ANOVA (≥3 means), proportion test, chi-square (categorical), Mann-Whitney (non-normal).
3. Plan sample size: Power analysis (target 80–90% power).
4. Randomize/assign: Ensure groups are comparable; record covariates.
5. Run test: Check assumptions (normality, equal variances); use robust/ non-parametric if violated.
6. Calculate effect size: Cohen’s d, η², Cramér’s V—report alongside p-values.
7. Adjust for multiplicity: If many comparisons, use Holm/Benjamini–Hochberg.
8. Interpret: P-value, CI, practical significance (not just statistical).
9. Rollout rule: Define decision thresholds before testing.
10. Deliverables: Test table, effect size, decision memo.
Example: Variant B improved CTR by +0.9 pp (p=0.012, d=0.22). Roll out to youthful segments; retest copy for others.
8. Time Series Analysis – Forecasting Trends
Time series is an important statistical technique in market research analysis studies data collected over time to predict future patterns.
Explanation: It helps businesses plan inventory, marketing, and budgets.
When to use: Predict demand, visits, call volumes, app installs.
Data needed: Regularly spaced time series (daily/weekly/monthly) + events/price/promos.
Steps of implementation
1. Plot & decompose: Level, trend, seasonality, anomalies.
2. Stabilize: Handle missing; adjust for outliers/holidays; consider log transform.
3. Stationarity check: ACF/PACF, unit-root tests; difference if needed.
4. Baseline model: Naïve/seasonal naïve to beat.
5. Choose methods: Exponential smoothing (ETS), ARIMA/SARIMA, Prophet, or ML (XGBoost/LSTM) with calendar features.
6. Cross-validation: Rolling/blocked CV; keep last k periods for testing.
7. Tune by accuracy: Use AIC/AICc (for ARIMA) and forecast metrics (MAPE, sMAPE, RMSE).
8. Incorporate exogenous vars: SARIMAX/ARIMAX with price, promo, temperature.
9. Scenario forecasts: “Diwali promo +10%” vs “no promo”.
10. Deliverables: Forecast plot with intervals, calendar of expected peaks, inventory action plan.
Example: SARIMAX with promo index improves MAPE from 14% → 8%; recommend +20% stock for festive weeks.
Application of Statistics in Marketing
The application of statistics in marketing helps businesses understand customer behavior, market trends, and buying patterns accurately. Using statistical methods, companies can improve pricing, promotions, and audience targeting. The application of statistics in marketing also supports better customer segmentation and campaign performance.
Today, the application of statistics in marketing is essential for analyzing survey data, measuring campaign effectiveness, and predicting consumer demand. These insights help businesses reduce risks, identify opportunities, and make smarter marketing decisions.
Conclusion
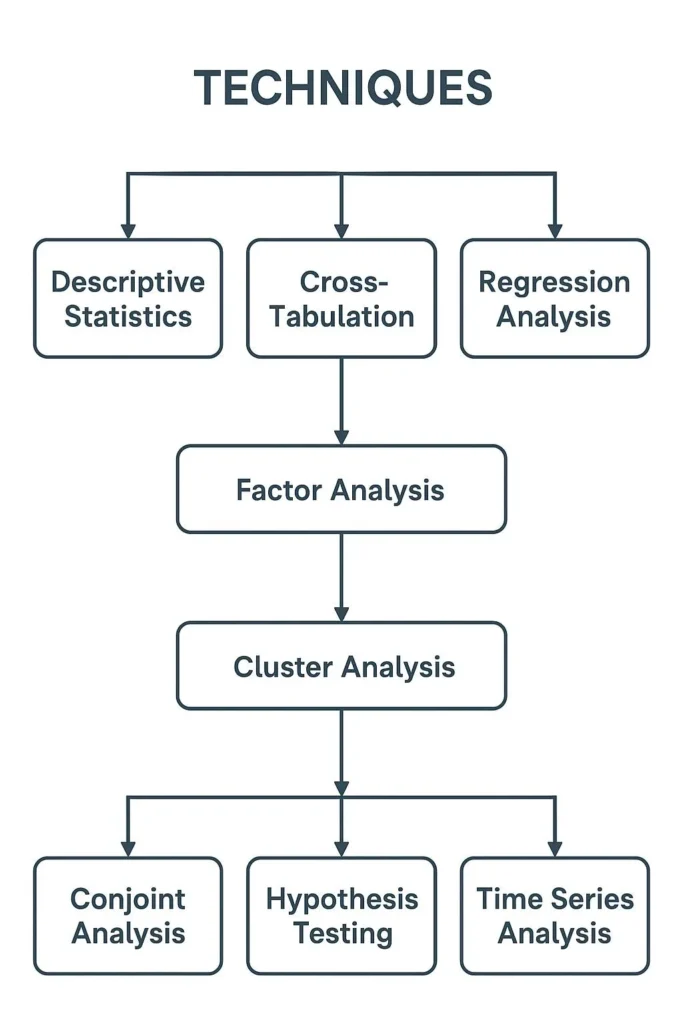
Statistical techniques in market research play a vital role in turning market data into practical insights. Descriptive tools highlight overall patterns, while cross-tabulation compares customer groups. Regression explains key drivers of sales, and factor analysis simplifies complex data into themes. Cluster analysis helps in segmenting customers, whereas conjoint analysis identifies trade-offs in preferences. Hypothesis testing validates assumptions, and time series analysis forecasts demand trends. Using market research statistical methods, analysts perform market research data analysis to uncover patterns, segment customers, identify key drivers, and forecast trends. At Simbi Labs of India, these statistical techniques are applied systematically, these methods answer what is happening, why it is happening, and what is likely next.
For an in-depth understanding, please refer to our book, “Academic Research Fundamentals: Research Writing and Data Analysis”. It is available as an eBook here, or you may purchase the hardcopy here .