
What Is AMOS Software? Full Form, Features and Uses in Data Analysis
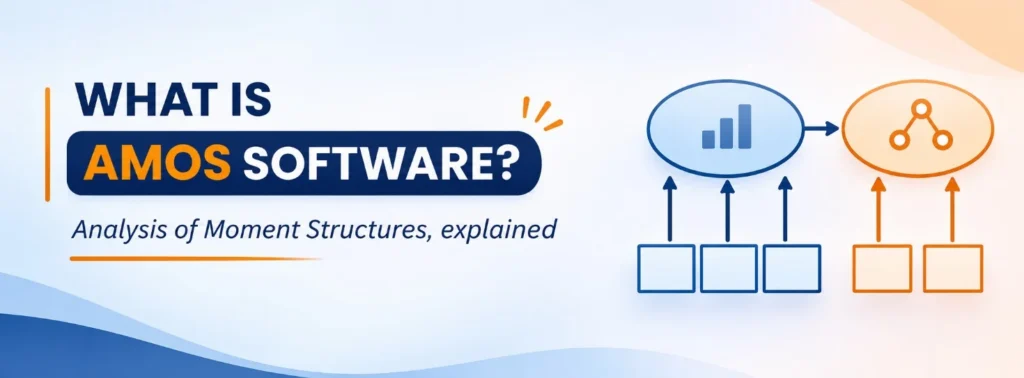
The researcher thinks that 1) good service quality increases customer satisfaction, 2) customer satisfaction increases their loyalty. Each of these concepts is assessed on the basis of multiple survey items and none of these concepts is directly observable. Ordinary regression is not very good at this type of question, since all of the variables are assumed to be measured without error, and it works on only one outcome at a time. AMOS is designed for just this kind of situation. This article provides a brief introduction to the AMOS software, its full form, functions, and a step-by-step guide to conducting AMOS data analysis.
What Is AMOS Software?
AMOS is statistical software that is employed in the construction and testing of models of relationships between variables. It is a software sold by IBM, and the software is primarily employed for structural equation modelling (SEM), typically referred to simply as SEM. The most important thing about it is that you draw the model: boxes, ovals and arrows are drawn on a canvas and the program makes the statistical model based on that.
In plain words: AMOS lets you sketch a theory, then checks how well your data agrees with it.
The table summarises the essentials.
| Item | Detail |
| Full form | Analysis of Moment Structures |
| Product name | IBM SPSS Amos |
| Main purpose | Structural equation modelling (SEM) and related model testing |
| Interface | Drawing path diagrams, with no programming needed for standard models |
| Typical users | Researchers in management, marketing, psychology, education and the social sciences |
| Platform | Windows; no macOS version is offered |
AMOS Software Full Form: Analysis of Moment Structures
Complete Form of AMOS is Analysis of Moment Structures. A moment in statistics is a summary of the data, for example, mean, variance and covariance. If the theory is correct, then a structural model makes predictions of the shape of these summaries. AMOS then checks the predictions against the numbers in your sample, and the closer they are, the more accurate the model.
In plain words: The name describes the job: compare the pattern the theory expects with the pattern the data shows.
So whenever you see the AMOS full form written as Analysis of Moment Structures, it refers to this idea of modelling covariance structures, and not to any acronym for a company or product line.
AMOS Full Form in Research: Why Researchers Use It
Now we know what the full form of AMOS is in research; we can now better understand why it is being so widely used in theses and journal articles. In many research questions in management, marketing, psychology or education concepts are indirectly measured, such as trust, attitude or motivation. There are three advantages of SEM for these questions.
Latent variables. A concept is measured by several items, and the model treats the concept itself as unobserved.
Measurement error. Each item is allowed to be imperfect, so errors are modelled instead of ignored.
Many relationships at once. Several outcomes and chains of effects, such as mediation, can be tested within one model.
Figure 1 shows the symbols you will meet in every AMOS diagram.
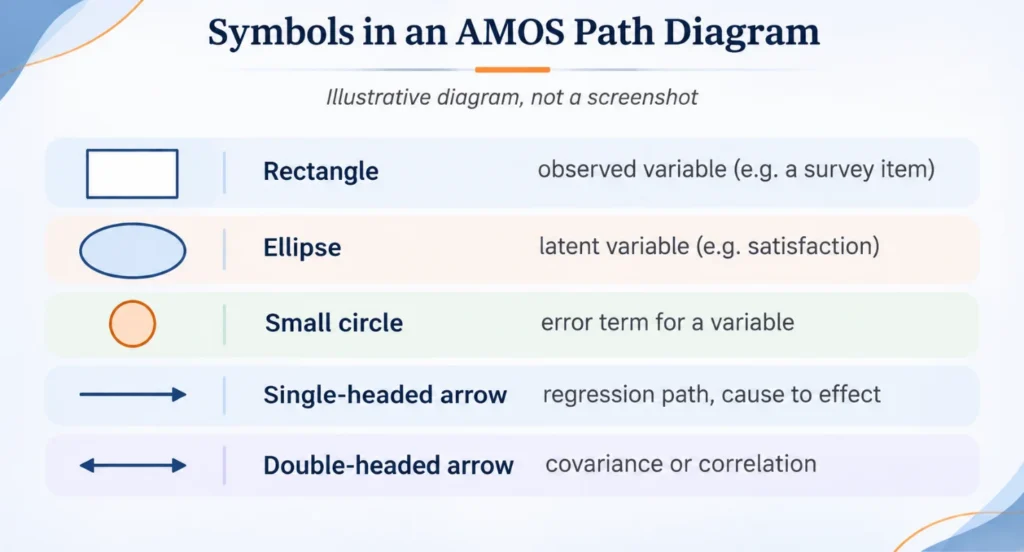
Figure 1: The five symbols used in AMOS path diagrams (illustrative drawing, not a software screenshot).
AMOS Software for Data Analysis: What It Can Do
Confirmatory factor analysis (CFA). Tests whether survey items group into the factors you expect. The structure is decided in advance from theory.
Path analysis. Tests chains of cause and effect between measured variables.
Full structural equation models. Combine the measurement part (items and factors) with the structural part (relationships between factors).
Mediation and moderation. Examine whether one variable carries the effect of another, or whether an effect changes across conditions.
Model fit assessment. Reports goodness-of-fit measures so that competing models can be compared.
One point is often confused. Exploratory factor analysis (EFA), which discovers a factor structure when none is known, is usually run in SPSS Statistics. AMOS is used for the confirmatory step that follows.
AMOS Data Analysis: Step-by-Step Workflow
A reliable AMOS data analysis follows the same sequence each time. Skipping early steps is the most common reason models fail later.
- State the theory. write the hypotheses and the expected direction of each relationship before touching the software.
- Prepare the data. clean the file, deal with missing values, and check for outliers and unusual response patterns. SEM generally needs larger samples than simple tests, and guidelines on the minimum vary.
- Run EFA if scales are new. in SPSS Statistics, to see whether items group as expected.
- Draw the measurement model. in AMOS, place each factor as an oval with its items as rectangles, each with an error term. Three or more items per factor is a common recommendation.
- Check the measurement model. review loadings and fit, and remove or revise weak items only with a sound reason.
- Add the structural paths. connect the factors with single-headed arrows according to the hypotheses.
- Estimate and read the output. review fit measures, estimates and significance, and test indirect effects, often with bootstrapping.
- Report. state the model, the sample, the fit measures and the estimates, and say plainly what the data does and does not support.
A Worked Example: Service Quality, Satisfaction and Loyalty
The model shown in Figure 2 suggests that service quality can influence loyalty in an immediate manner, an indirect (mediated) manner through satisfaction, or both. The values do not represent real data and are only given as examples of how to read the output.
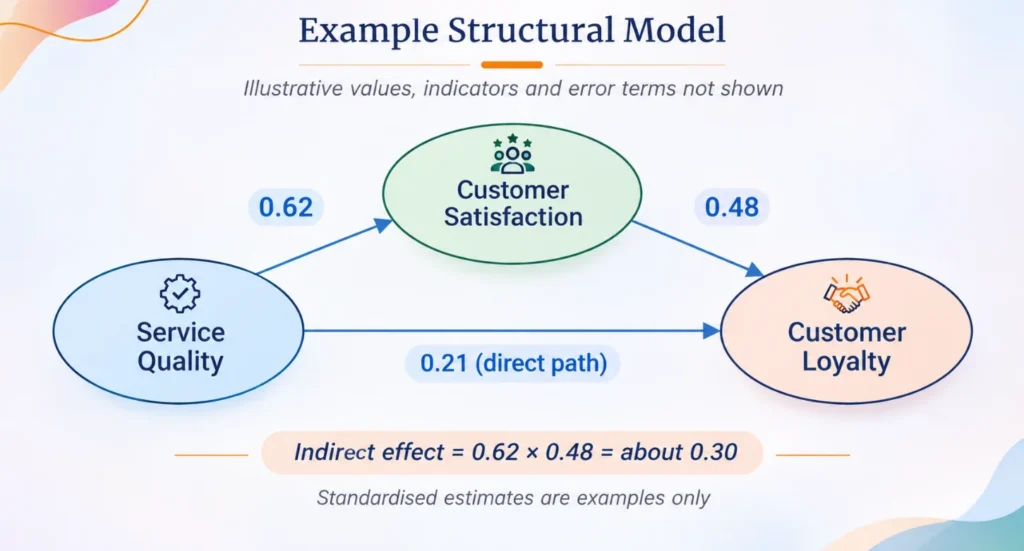
Figure 2: A simple structural model with example standardised estimates (illustrative).
Reading the example: service quality and satisfaction are correlated at 0.62, and satisfaction with loyalty at 0.48. That is, the indirect effect of service quality on loyalty is the product of the two paths, that is, 0.62 x 0.48 = 0.30. Adding a direct distance of 0.21 to it. This would also be included in a real report as an indication of whether each path is statistically significant, and a confidence interval for the indirect effect.
Reading AMOS Output: Model Fit Measures
There may be several fit measures reported by AMOS since one measure does not reveal the entire story. The values in the guide are general and widely quoted values, but they are not rules, so include a number of measures and explain your decisions.
| Fit Measure | What It Checks | Commonly Cited Guide |
| Chi-square (CMIN) and p-value | Whether the model reproduces the data exactly | Often significant with large samples, so rarely used alone |
| CMIN/DF | Chi-square relative to model complexity | Below about 3 is often treated as good |
| CFI and TLI | Improvement over a model with no relationships | 0.90 or higher acceptable; 0.95 or higher good |
| RMSEA | Error of approximation per degree of freedom | 0.08 or lower acceptable; 0.06 or lower good |
| SRMR | Average residual between observed and model correlations | 0.08 or lower |
A model that fits well is not proven true. Different models can fit the same data equally well, so the theory and the study design still carry the argument.
Common Mistakes in AMOS Data Analysis
Skipping the measurement model. Fitting the full model first hides problems with individual factors.
Changing the model to chase fit. Modification suggestions should be followed only when they make theoretical sense, and any changes must be reported.
Relying on one fit measure. Report several, and explain the ones that fall short.
Claiming cause from correlational data. Arrows show the theory you tested, not proof that one thing causes another.
Ignoring sample size and missing data. Both affect estimates and fit, and both should be described.
Simbi Labs’ IBM SPSS AMOS Support
Building and checking an SEM model takes care with theory, data and interpretation. Simbi Labs offers IBM SPSS AMOS and statistical data analysis support for research projects, and you can discuss your study through the contact page.
Statistical Data Analysis Services
Frequently Asked Questions
1.What is AMOS software?
It is IBM SPSS Amos, software for structural equation modelling in which models are drawn as path diagrams and tested against data.
2. What is the AMOS full form?
The AMOS full form is Analysis of Moment Structures.
3. What is the AMOS software full form in research use?
It is the same: Analysis of Moment Structures. In research it refers to modelling the covariance structure among variables to test a theory.
4. What is AMOS software for data analysis used for?
It is used for confirmatory factor analysis, path analysis, full SEM, and mediation and moderation tests.
5. How does an AMOS data analysis begin?
With a clear theory and a clean dataset, followed by a measurement model for each concept before any relationships between concepts are added.
6. Can AMOS run on a Mac?
There is no macOS version of AMOS, so it is used on Windows.