
Slope, Contour and Hill shade Analysis Using QGIS: Understanding Terrain Characteristics of Barabar Hills
Three layers explain most of what a hill looks like: how steep it is, how high each part sits, and how the light falls on it. This tutorial shows how to make all three from one DEM. It covers slope analysis using QGIS, contour mapping using QGIS and hillshade analysis in GIS, and shows how to combine them for terrain visualization using QGIS. Barabar Hills in Bihar is the example area, but the method works on any DEM.
What You Need for Slope Analysis QGIS Projects
- QGIS (any recent version) with the Processing Toolbox enabled.
- A DEM of the Barabar Hills area, for example SRTM or Copernicus GLO-30 at about 30 m resolution.
- A projected coordinate system in metres. The area lies at about 85°E, so UTM zone 45N (EPSG:32645) is a suitable choice.
The Tools at a Glance
Topographic analysis using DEM relies on a handful of tools. The table lists their main settings and outputs. Tool names and default values come from the QGIS documentation; menu positions can differ a little between versions.
Read Also : GIS-Based Terrain Mapping: Analysing Elevation and Landforms of Barabar Hills, Bihar
| Tool | Key settings | What it gives you |
| Slope | Elevation layer; Z factor (default 1.0) | Terrain inclination, in degrees |
| Aspect | Elevation layer; Z factor (default 1.0) | Direction each slope faces, 0 to 360 degrees clockwise from north |
| Hillshade | Z factor (1.0); azimuth (300); vertical angle (40) | Shaded relief with values from 0 (full shadow) to 255 (full sun) |
| Ruggedness index | Elevation layer; Z factor (1.0) | Terrain roughness, from elevation differences with the 8 neighbouring cells (Riley et al., 1999) |
| Contour (GDAL) | Interval between lines; optional attribute name | Vector contour lines; elevation is stored only if you name an attribute |
Step-by-Step Tutorial
Step 1: Load and prepare the DEM
Add the DEM to QGIS, clip it to a boundary around Barabar and Nagarjuni hills, and reproject it to UTM zone 45N. This matters because slope compares height with horizontal distance, and both should be in metres.
Path: Layer > Add Layer > Add Raster Layer; then Raster > Extraction > Clip Raster by Mask Layer; then Raster > Projections > Warp (Reproject)
What you should see: A clipped DEM in metres, drawn in a grey or colour ramp.
Step 2: Run slope analysis in QGIS
Slope analysis using QGIS gives each cell the inclination of the ground in degrees. Open the Slope tool, choose your DEM, keep the Z factor at 1.0 if the horizontal and vertical units are both metres, and run it. Many guides call this QGIS slope analysis, and others write slope analysis QGIS, but the tool is the same. A QGIS slope analysis needs only a DEM and a few clicks.
Path: Processing Toolbox > Raster terrain analysis > Slope
What you should see: A raster in which steep ground has high values. Style it with a graduated colour ramp.
The slope classes below are an example grouping. Choose classes that suit your own project and print them on the map.
| Slope class | Degrees | Reading |
| Gentle | 0 to 5 | Flat or nearly flat ground |
| Moderate | 5 to 15 | Easy to walk, visible incline |
| Steep | 15 to 30 | Demanding climb, rapid runoff |
| Very steep | Above 30 | Rock faces and cliffs, limited access |
Step 3: Create contour lines
Contour mapping using QGIS turns the DEM into lines of equal elevation. Open the Contour tool, choose the DEM, and set the interval between lines. If you also want each line to carry its elevation, enter an attribute name, because the elevation is stored only when a name is given.
Path: Raster > Extraction > Contour
What you should see: A line layer. Closely spaced lines show steep ground, and widely spaced lines show gentle ground, as Figure 2 shows further down.
Step 4: Make a hillshade
Hillshade analysis in GIS simulates light falling on the terrain, which gives a map a three-dimensional look. In QGIS the Hillshade tool uses an azimuth of 300 degrees and a vertical angle of 40 degrees by default, and produces values from 0 (full shadow) to 255 (full sun).
Path: Processing Toolbox > Raster terrain analysis > Hillshade
What you should see: A grey relief image. Figure 1 shows how the same surface looks with light from two different directions.
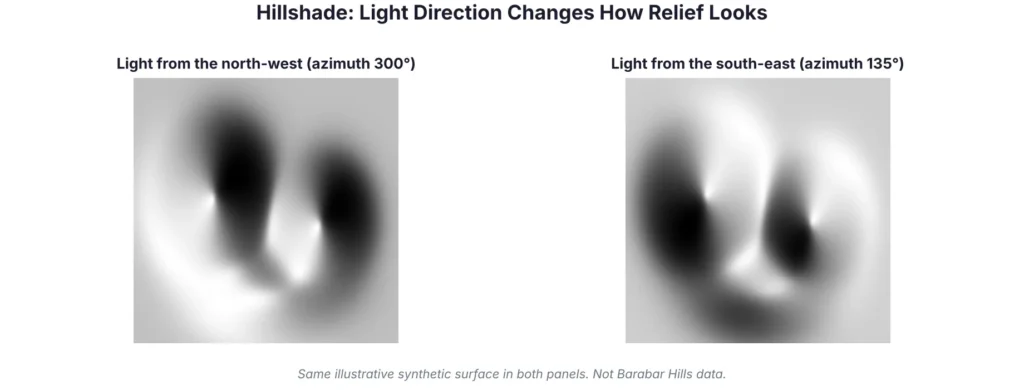
Figure 1: The same synthetic surface lit from two directions.
Step 5: Add aspect and ruggedness (optional)
Aspect shows which way each slope faces, from 0 to 360 degrees clockwise from north. The Ruggedness index describes how rough the terrain is, using the elevation differences between each cell and its eight neighbours. Both help to describe terrain characteristics beyond steepness.
Path: Processing Toolbox > Raster terrain analysis > Aspect; Ruggedness index
Step 6: Combine the layers for terrain visualization
Terrain visualization using QGIS comes from stacking the layers. Place the hillshade at the bottom, set the DEM above it in a colour ramp at partial transparency, and draw the contours on top. Use the slope layer in a separate map or as a classified overlay.
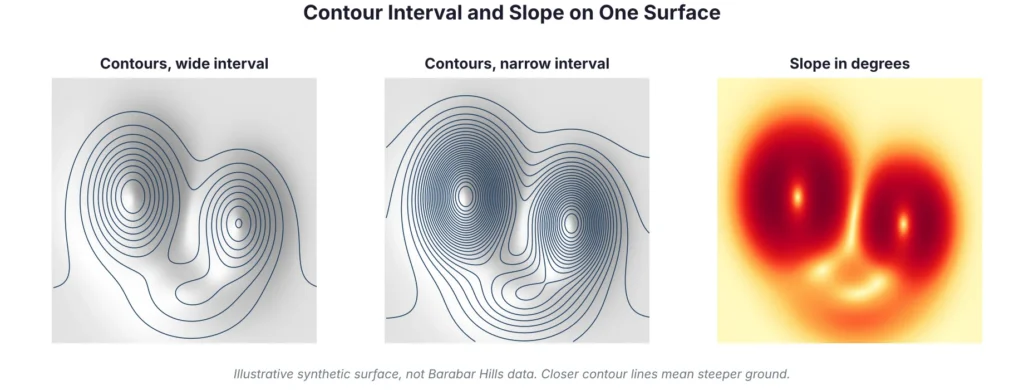
Figure 2: Contour lines at two intervals, and slope, from one synthetic DEM.
Reading Terrain Characteristics of Barabar Hills
A good QGIS slope analysis does not end with the raster. It ends with a reading of what the numbers mean for the place, as the next paragraph shows.
Once the layers are ready, read them together. Steep, high-slope cells mark rock faces and ridge flanks. Closely spaced contours confirm the same areas. Aspect shows which way slopes face, and hillshade makes the shapes easy to see. Barabar Hill and Nagarjuni Hill, about 1.6 km apart, are made of granite, which is a hard rock, so the area is a useful test of how terrain tools describe rocky relief. Record what you see in your own results, and avoid copying numbers from other sites.
Read AlSO : GIS and Remote Sensing: Basics, Applications and Benefits
Mistakes to Avoid
| Common mistake | How to avoid it |
| Running slope on a DEM in degrees (lat/long) | Reproject to a metre-based system such as UTM zone 45N (EPSG:32645) first |
| Using a Z factor without checking units | Keep 1.0 when horizontal and vertical units are both metres |
| Contour interval too fine for a 30 m DEM | Choose an interval the data can support and check the result visually |
| Only one hillshade direction | Try a second light angle to avoid misreading relief |
| Treating example slope classes as a standard | Choose classes to suit your project and state them on the map |
Accuracy and Limits
A 30 m DEM smooths small features, so cave entrances, steps and narrow ridges will not appear. Global DEMs also record the surface the sensor saw, which can include trees. Use drone data and GPS points for detail, and describe the data source on every map.
| Final check before you share the maps | |
| ☐ | DEM in a metre-based coordinate system, with source and date noted |
| ☐ | Slope, aspect, hillshade and contour layers all use the same DEM |
| ☐ | Contour interval and slope classes written in the map legend |
| ☐ | Hillshade settings (azimuth, vertical angle) recorded |
| ☐ | Results compared with field photographs or GPS points |
Conclusion
Slope, contour and hillshade layers together turn a DEM into a map that people can read. With the steps above, you can complete a QGIS slope analysis, carry out topographic analysis using DEM for the Barabar Hills, produce clear terrain visualization using QGIS, and explain the choices behind each layer.
Simbi Labs supports organisations with GIS mapping and field data collection. You can read about our GIS survey services and our guide to data collection in GIS, or contact us to discuss your project.
Frequently Asked Questions
1. How do I do slope analysis QGIS users ask about most?
Load a DEM in a metre-based coordinate system, open the Slope tool in the Raster terrain analysis group, keep the Z factor at 1.0 and run it.
2. What does slope analysis using QGIS measure?
It measures the inclination of the ground at each cell, in degrees.
3. How is contour mapping using QGIS done?
Use the Contour tool from the Raster menu, set an interval between lines and, if needed, an attribute name that stores the elevation.
4. What is hillshade analysis in GIS?
It is a shaded relief image that simulates light falling on terrain, using a chosen azimuth and vertical angle.
5. How can I improve terrain visualization using QGIS?
Stack a hillshade, a semi-transparent DEM colour ramp and contour lines, and check the result with a second light direction.
6. What is topographic analysis using DEM?
It is the use of an elevation model to derive terrain measures such as slope, aspect, contours and hillshade.
Sources
QGIS documentation: Raster terrain analysis (version 3.22 page); GDAL: gdal raster contour; Barabar Caves (Wikipedia).