
Advanced Statistical Data Analysis: Methods, Types & Examples
Introduction
The modern world has become a digital information age, where organizations collect data on a massive scale from customers and interactions, business processes, research and digital technologies. But gathering the data is not the end goal; the real benefit lies in analyzing the data to gain meaningful insights and to help make better decisions. That’s where sophisticated statistical analysis can be of great help.
It is not a simple statistical technique that just analyzes data but also helps discover relationships between variables and hidden patterns, and make predictions on future outcomes. This has led to the growing need of businesses, researchers, healthcare institutions, financial entities, and others to use advanced data analysis methods to address complex challenges and make informed decisions.
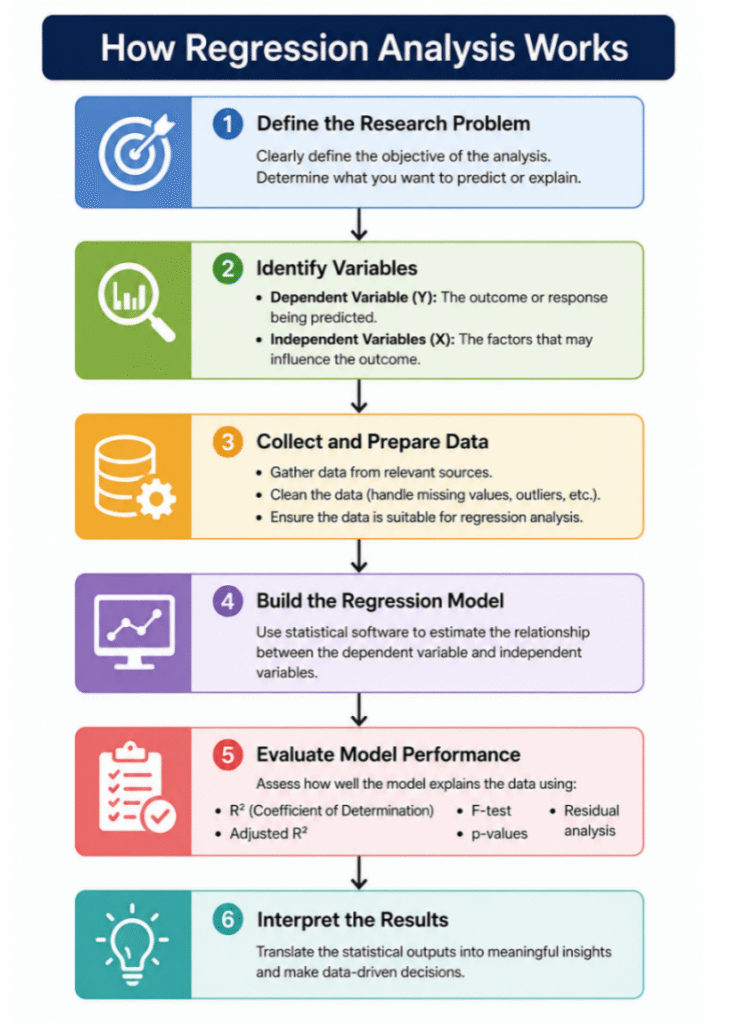
One of the most widely used and influential of the many advanced statistical methods is Regression Analysis. It is used to assess the influence of various factors on an outcome, thus is a crucial tool that facilitates prediction, performance measurement and predictive analytics. This article describes in detail the advanced statistical analysis by discussing in detail about regression analysis. Concept of regression analysis, types of regression analysis, application of regression analysis, assumptions of regression analysis, benefits of regression analysis, real life application of regression analysis.
READ ALSO: Multiple Linear Regression
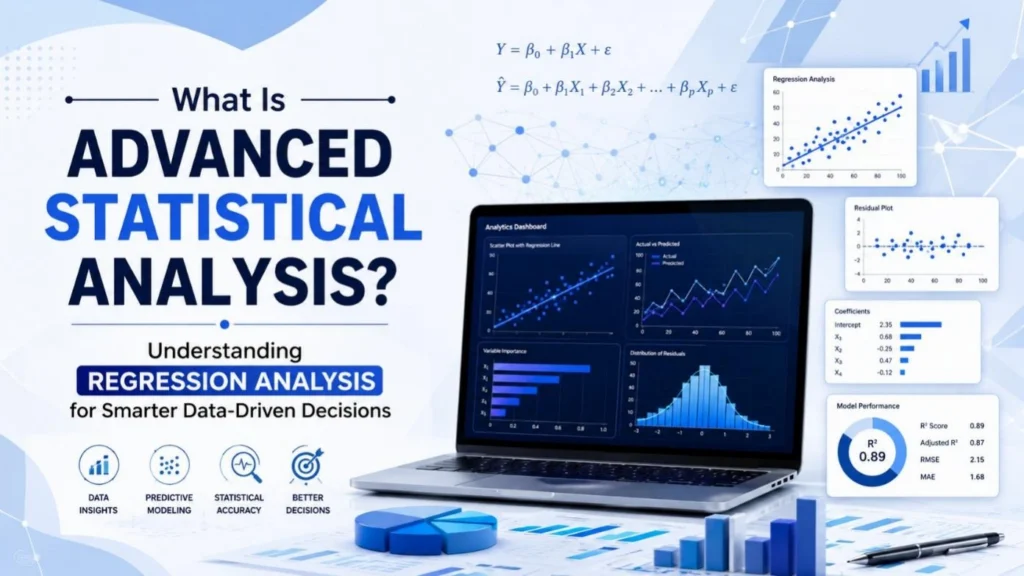
What Is Advanced Statistical Analysis?
Advanced statistical analysis is a statistical process that involves applying sophisticated statistical models and mathematical techniques to analyse complex data sets, to establish relationships among the various sets of data, to test hypotheses and to make reliable predictions.
Advanced statistical analysis is more than just describing data, it is used to explain the patterns and to make predictions about the future. Advanced statistical methods are used to solve complicated problems which cannot be solved by simple calculations. For instance, a company might want to find out the combined effect of advertising, product pricing, customer satisfaction, and seasonality on sales.
Rather than using an analysis of each factor alone, the advanced statistical techniques will evaluate all the factors relevant to the prediction together to determine which are most significant and to make accurate predictions.
Regression analysis is one of the most popular methods for sophisticated analysis of data. It assists in understanding how variables relate to each other, in determining the effect of various factors on the outcome, and in making decisions based on the data. Regression analysis is one of the most useful tools in advanced statistical analysis due to its wide range of use and prediction..
Characteristics of Advanced Statistical Analysis
Advanced statistical analysis is not the same as basic statistics, as it offers more insightful information and aids in decision making. It has the following important features:
1. Recognizes Relationships: Determines how various variables relate and interact.
2. Supports Predictions: Makes predictions based on past information.
3. Analyzes Complex Data: is able to process large amounts of complex data.
4.Measures Uncertainty: Guesses the closeness of results and risks.
5. Assists in Research: Leads researchers to test statements and to draw correct, well-informed conclusions.
Why Regression Analysis Is Considered an Advanced Statistical Method
There are more than one factor that influences numerous business decisions. There are many interconnected variables that impact customer satisfaction, production efficiency, healthcare outcomes, and financial performance. These relationships do not come across well in traditional statistics summaries.
Regression analysis addresses this challenge by:
- Measuring the strength of relationships between variables.
- Predicting future outcomes using historical data.
- Identifying the most influential factors affecting an outcome.
- Supporting evidence-based decision-making.
- Quantifying uncertainty using statistical measures.
- Helping organizations optimize strategies based on measurable evidence.
Understanding Regression Analysis: The Foundation of Advanced Statistical Analysis
Of all the advanced statistical techniques available, regression analysis is one of the most powerful and widely-used techniques for identifying relationships in the data and making accurate predictions.
From predicting sales figures to forecasting healthcare performance to assessing marketing success to risk analysis in the financial sector, regression analysis offers a mathematical model that turns data into insights.
What Is Regression Analysis?
Regression analysis is a statistical method that is used to investigate the relationship between one dependent variable (that is being explained) and one or more independent variables (those that are used to explain the dependent variable).
The main goal is to predict the change in the response variable(s) based on the changes in one or more predictor variable(s). This property of regression analysis of being able to single out the effects of individual variables makes it one of the most reliable high-level statistical methods to understand complex business problems.
The Mathematical Foundation of Regression Analysis
The simplest regression model is represented by the following equation:
Y = β₀ + β₁X + ε
Although the equation appears technical, each component has a practical meaning.
| Symbol | Meaning |
| Y | Dependent variable (the outcome being predicted) |
| β₀ | Intercept or baseline value of the outcome |
| β₁ | Regression coefficient representing the effect of X on Y |
| X | Independent variable |
| ε | Random error representing unexplained variation |
Case Study: Regression Analysis in Sales Forecasting
A retail company wanted to know whether increasing its advertising budget would improve monthly sales. After applying regression analysis to its sales data, the company found that every additional ₹10,000 spent on advertising increased sales by an average of ₹85,000. This helped the company make confident, data-driven decisions instead of relying on assumptions.
Types of Regression Analysis
Regression analysis includes several specialized models designed for different types of research questions and datasets. Selecting the appropriate model depends on the characteristics of the dependent variable and the complexity of the relationship being studied.
| Regression Type | Why We Use It | When to Use It | Best For / Example Applications |
| Linear Regression | To measure the relationship between one independent variable and one continuous dependent variable. | Use when there is a straight-line (linear) relationship between two continuous variables. | Predicting house prices from property size, estimating sales based on advertising spend, forecasting temperature trends. |
| Multiple Regression | To understand how multiple independent variables influence a single continuous outcome. | Use when several factors jointly affect the dependent variable. | Predicting employee salaries based on education, experience, and skills; estimating customer spending using age, income, and location. |
| Logistic Regression | To predict the probability of categorical outcomes (usually Yes/No or 0/1). | Use when the dependent variable is binary or categorical rather than continuous. | Disease diagnosis (positive/negative), loan approval (approved/rejected), fraud detection, customer churn prediction. |
| Polynomial Regression | To model curved or non-linear relationships between variables. | Use when data does not follow a straight line but shows a curve or changing trend. | Population growth, crop yield prediction, product demand over time, biological growth patterns. |
| Ridge Regression | To improve prediction accuracy when independent variables are highly correlated (multicollinearity). | Use when many predictor variables are strongly related to each other and model stability is important. | Financial forecasting, stock market analysis, economic modeling, machine learning with numerous correlated features. |
| Lasso Regression | To simplify models by automatically selecting the most important variables and removing less relevant ones. | Use when working with high-dimensional datasets containing many predictor variables. | Gene expression analysis, customer behavior modeling, marketing analytics, predictive modeling with hundreds of features. |
Key Assumptions of Regression Analysis
1. Linear: The relationship between the independent variable(s) and the dependent variable should be linear. This implies that the relationships between the predictor variables and the outcome variable should be proportional.
What about if this assumption is not met?
If the actual relationship is curved or nonlinear, but a linear regression model is applied, the model attempts to find a straight line through data that has a more complex pattern. As a result:
a.Predictions become inaccurate
b.The regression coefficients are no longer a true picture of the relationship.
c. Values can be underestimated or over-estimated in the model.
d. Sometimes, there are systematic patterns in the residual plots, rather than random scatter.
e. The model’s explanatory power (R²) is reduced due to the fact that it is unable to capture the real trend.
2. Independence of Observations: It should be independent observations. No observations should be skewed by another observation.
What if this assumption is not met?
If observations are correlated with each other (autocorrelation):
a.The standard errors are wrong.
b.Confidence intervals are not accurate.
c.p-values become misleading.
d.Statistically significant variables can be significant but are not.
e.Researchers might mistakenly believe that an important relationship is present.
3 Equal Variance (Homoscedasticity): The variance of the residuals (prediction errors) should be the same at all points on the independent variable(s), which indicates that prediction errors should not change significantly as predicted values increase or decrease. What if this assumption is incorrectly made?
If the residuals are not the same size across the range of predictions (also known as heteroscedasticity):
a.Typically, regression coefficients are unbiased.
b.However, they lose their standard errors.
c.Confidence intervals are too large or small.
d.Hypothesis tests lose their validity.
e. p-values can give misleading conclusions or miss important relationships.
4. Normal distribution of residuals: Residuals should be normally distributed, although this assumption does not need to be made for prediction, it is primarily for statistical inference.
What about if this assumption is not met?
If the residuals are very skewed or have unusually heavy tails:
a.There are inaccuracies in confidence intervals.
b. p-values become unreliable.
c. Hypothesis testing becomes invalid.
d.This is especially true of small sample studies.
5. No Multicollinearity:The independent variables should not be strongly correlated with each other, each predictor should provide information that is not provided by the other predictors.
What about if this assumption is not met?
If predictors have little or no different information:
- The regression coefficients are unstable.
- Coefficient estimates can change drastically when the data set changes slightly
- Standard errors increase.
- One of the most important factors can be overlooked.
- It can be hard to know which of the predictors is actually affecting the outcome.
- No Extreme Outliers: The data set must not have data points at the extreme ends that are significantly far removed from the rest of the data set without good reason. The following factors can cause outliers:
- Data entry mistakes
- Measurement errors
- Very scarce but authentic observations
What about if this assumption is not met?
Extreme observations can have too much influence on the regression line. Consequences include:
1.Biased regression coefficients.
2.Distorted slope estimates.
3.Lower prediction accuracy.
4.Reduced model reliability.
5.Incorrect statistical significance
6.Lack of ability to generalize to new data.
Applications of Regression Analysis in Advanced Statistical Analysis
Regression analysis is one of the most widely used advanced statistical methods because it helps identify relationships between variables and predict future outcomes. Its ability to support data-driven decision-making makes it an essential tool in advanced data analysis across many industries.
Business and Marketing: Businesses use regression analysis to forecast sales, evaluate marketing campaigns, optimize pricing, and understand customer behavior.
Healthcare: Healthcare professionals apply regression analysis to predict disease risk, assess treatment effectiveness, and improve patient care.
Finance and Banking: Banks and financial institutions use regression analysis for credit risk assessment, loan default prediction, fraud detection, and investment forecasting.
Manufacturing: Manufacturers use regression analysis to improve product quality, optimize production processes, and predict equipment maintenance needs.
Education and Research: Researchers use regression analysis to study student performance, analyze survey data, and evaluate educational programs.
Conclusion
Regression analysis is a robust statistical method that can be used to find relationships between variables, forecast future trends, and guide informed decisions. There are a number of regression models available, each with its own focus on data types and research purposes, such as linear regression, multiple regression, logistic regression, polynomial regression, Ridge regression and Lasso regression. The selection of the appropriate regression technique is key to ensuring accurate insights, precise predictions, and informed business decisions in various sectors including business, healthcare, finance, marketing, and research. When and how to apply each regression model can open the doors to the real value of data and to well-informed, evidence-based decision making.
Schedule a free consultation today.
For inquiries, contact us at: grow@simbi.in