
Statistical Data Analysis with SPSS: A Comprehensive Guide
Organizations today generate enormous volumes of data, but collecting data alone is not enough. The true value lies in analyzing that data accurately to uncover meaningful insights that support informed decision-making. Whether conducting academic research, business analytics, healthcare studies, or market research, statistical data analysis plays a crucial role in identifying trends, testing hypotheses, and solving complex problems.
IBM SPSS Statistics is one of the world’s most trusted statistical software packages for performing reliable data analysis. With its intuitive interface, comprehensive statistical procedures, and powerful reporting capabilities, SPSS enables researchers, students, analysts, and organizations to transform raw data into actionable insights efficiently.
This guide is a detailed discussion of the relevance, procedure, and real-world use of statistical data analysis using SPSS that the readers can learn how to utilize its power to their full potential either in research and business intelligence.
Introduction to SPSS
In the modern era of data analysis, organizations, researchers, and academic institutions rely heavily on accurate statistical methods to make informed decisions. Statistical data analysis with SPSS has become one of the most effective approaches for handling complex datasets and generating meaningful insights. IBM SPSS Statistics is widely recognized for its ability to simplify advanced statistical procedures while maintaining analytical precision.
SPSS, which stands for Statistical Package for the Social Sciences, was originally developed for social science research. Over time, it has expanded into multiple fields such as healthcare, education, business, marketing, finance, and engineering. Today, SPSS is considered one of the most reliable tools for statistical data analysis because it combines advanced analytical capabilities with a user-friendly interface.
One of the major reasons behind the popularity of data analysis with SPSS is that it allows users to conduct both simple and advanced statistical tests without extensive programming knowledge. Researchers and professionals can efficiently perform statistical procedures, visualize findings, and generate reports within a single platform.
Why Do Researchers Choose SPSS?
IBM SPSS Statistics has become one of the most widely used statistical software packages because it combines analytical accuracy with ease of use. Unlike programming-based tools, SPSS allows users to perform complex statistical analyses through a graphical interface while still supporting syntax-based automation for advanced users. This flexibility makes SPSS suitable for students, researchers, healthcare professionals, business analysts, and organizations seeking reliable statistical results without extensive programming expertise.
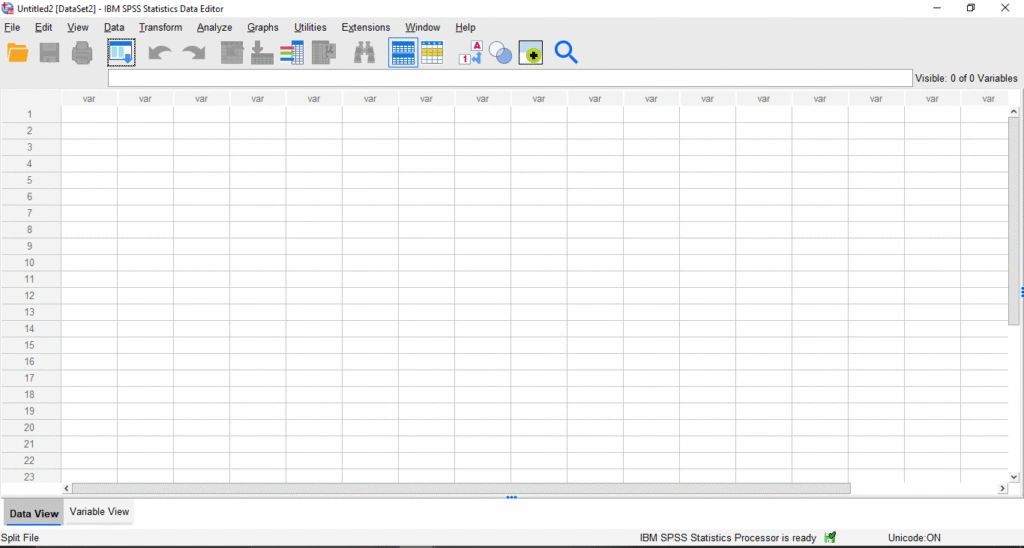
Overview of the SPSS Interface
IBM SPSS Statistics provides a highly interactive and user-friendly workspace for conducting statistical data analysis. The software interface mainly consists of the Data View and Variable View tabs, output viewer, syntax editor, and chart builder. These tools enable researchers and analysts to manage datasets, perform statistical tests, visualize findings, and generate professional reports efficiently.
The intuitive design of SPSS makes it especially useful for beginners who are learning data analysis and statistical interpretation for the first time.
Understanding Statistical Data Analysis
Statistical data analysis refers to the systematic process of collecting, organizing, cleaning, analyzing, and interpreting data to discover patterns, trends, and relationships. The primary objective of statistical analysis is to transform raw information into actionable insights that support evidence-based decision-making.
In statistical data analysis with SPSS, researchers use various statistical techniques to summarize data, test hypotheses, identify relationships between variables, and predict future outcomes. SPSS supports both descriptive and inferential statistical methods, making it suitable for academic research as well as industrial applications.
Phases of Statistical Data Analysis with SPSS
Accurate statistical data analysis with SPSS involves several important stages. Each stage contributes to the reliability and validity of the final findings.
1. Data Entry and Preparation
The first step in data analysis with SPSS is entering and organizing the dataset properly. Entering and cleaning of data should be done properly and the data should be cleaned before analysis to eliminate un-coherent data. The SPSS offers a Data View where the data can be entered and a Variable View where the type, labels and measurement scale of the variable can be defined. Making sure that this phase is accurate will avoid inaccurate findings.
2. Data Cleaning and Transformation
Data cleaning is one of the most critical stages of statistical data analysis. Data cleaning involves identifying missing data, outliers and wrong records. SPSS provides functions that can be used to deal with the missing values by replacing them with some values or imputing them and recodes and transforms variables. Correct cleaning will make the analysis of statistical data with SPSS valid.
3. Descriptive Analysis
The step summarizes data by using various measurements such as mean, median, mode, standard deviation and frequency distributions. Descriptive statistics provide an overview of data behavior before advanced inferential tests are performed. In statistical data analysis with SPSS, descriptive analysis helps researchers understand data patterns and distributions efficiently.
4. Inferential Analysis
Inferential statistics assist in generalizing on a sample to a population. Hypotheses are tested and relationships between variables formed using such techniques as t-tests, ANOVA, correlation, and regression. The SPSS makes these analyses complex through available commands.
5. Interpretation and Reporting
The final stage of statistical data analysis with SPSS involves interpreting results and preparing reports. SPSS automatically generates tables, charts, graphs, and statistical summaries that simplify result interpretation.
Researchers can export these outputs into Word, Excel, PDF, and presentation formats for academic and professional reporting.
Key Features of SPSS for Statistical Analysis
The key to the successful usage of SPSS as one of the most popular resources is in a set of functions, which enable statistical analysis of the data with SPSS to be both affordable and effective:
- User-Friendly Interface: SPSS is said to have a menu based environment in which users can be able to carry out an analysis with minimal amount of programming.
- Data Management Capabilities: The software is able to manage large volumes of data effectively as well as supporting various file formats and offering features to merge, reshape, and filter data.
- Advanced Statistical Techniques: SPSS is compatible with regression analysis, factor analysis, MANOVA, as well as time-series prediction.
- Visualization Tools: SPSS has a powerful chart-building tool that creates histograms, scatterplots and boxplots to provide visual display.
- Automated Reporting: It is easy to save syntax commands, create reproducible analysis and generate standardized reports.
Commonly Used Statistical Techniques in SPSS
The table provided below points out the most common statistical methods used in SPSS and their purposes:
| Statistical Method | Purpose | Application Example |
| Descriptive Statistics | Summarize and describe data | Understanding demographic distribution |
| Correlation Analysis | Measure the relationship between variables | Studying income vs. expenditure patterns |
| Regression Analysis | Predict dependent variable based on independent variables | Forecasting sales using marketing spend |
| ANOVA (Analysis of Variance) | Compare means across multiple groups | Comparing academic performance among classes |
| Factor Analysis | Identify underlying constructs or dimensions | Grouping similar survey items into themes |
| Chi-Square Test | Examine association between categorical variables | Testing relationship between gender and purchase behavior |
The methods are the basis of statistical analysis of data using SPSS making it possible to answer a broad range of research questions in a statistically precise manner.
Advanced Applications of SPSS
While many researchers use IBM SPSS Statistics software for basic statistical tests, it is also a powerful SPSS data analysis software solution capable of performing advanced statistical modeling and predictive analytics. From academic research to business intelligence, statistical analysis SPSS supports a wide range of sophisticated analytical techniques that help organizations make data-driven decisions.
1. Predictive Analytics
Using SPSS Statistics software, researchers and analysts can build linear regression and logistic regression models to predict future outcomes based on historical data. Statistical analysis SPSS is widely applied in healthcare, marketing, banking, and finance for forecasting trends, assessing risks, and identifying customer behavior patterns.
2. Factor and Cluster Analysis
IBM SPSS Statistics software provides advanced factor analysis and cluster analysis techniques to uncover hidden relationships within datasets. Factor analysis helps identify underlying variables, while cluster analysis groups similar observations based on shared characteristics. These methods are commonly used for market segmentation, customer profiling, and social science research.
3. Time-Series Analysis
As a comprehensive SPSS data analysis software, SPSS includes time-series forecasting tools that enable users to analyze trends and seasonal patterns over time. Businesses use these features to forecast sales, estimate product demand, monitor financial performance, and support long-term strategic planning.
4. Reliability and Validity Testing
One of the most valuable features of IBM SPSS Statistics software is its ability to evaluate the reliability and validity of research instruments. Researchers frequently use Cronbach’s Alpha to measure the internal consistency of questionnaires and survey scales, ensuring accurate and dependable research findings through statistical analysis SPSS.
5. Multivariate Analysis
SPSS Statistics software supports advanced multivariate techniques such as MANOVA, discriminant analysis, principal component analysis (PCA), and canonical correlation analysis. These methods allow researchers to examine multiple dependent variables simultaneously, making SPSS data analysis software suitable for complex research in education, healthcare, psychology, business, and social sciences.
Why These Advanced Features Matter
The advanced capabilities of IBM SPSS Statistics software extend far beyond basic hypothesis testing and descriptive statistics. Whether you are conducting academic research, business analytics, healthcare studies, or market research, statistical analysis SPSS provides reliable tools for handling complex datasets, building predictive models, and generating meaningful insights. This makes SPSS data analysis software one of the most trusted statistical platforms for researchers, students, and professionals worldwide.
Industries That Use SPSS
SPSS is widely applied across multiple sectors because of its flexibility and extensive statistical capabilities. Common application areas include:
- Academic and university research
- Healthcare and clinical research
- Pharmaceutical studies
- Market research
- Banking and finance
- Government surveys
- Human resource analytics
- Manufacturing quality control
- Educational assessment
- Social science research
Its versatility makes SPSS one of the most preferred statistical software packages across diverse industries.
Interpreting and Reporting SPSS Output
Using SPSS generates detailed tables of output in which test statistics, levels of significance (p-values) and confidence intervals are presented. In statistical data analysis, proper interpretation of these outputs is essential.
For instance:
- A p-value less than 0.05 typically indicates a statistically significant difference.
- Correlation coefficients (r) reveal the strength and direction of relationships between variables.
- Regression coefficients (β) show the influence of predictors on an outcome variable.
Through a critical interpretation of these metrics, statistical analysis of data using SPSS can convert raw data into evidence-based information that may be used in decision making and policy development.
Advantages of Using SPSS for Statistical Data Analysis
- Efficiency: SPSS automates many manual calculations, saving time.
- Accuracy: In-built algorithms minimize errors in computation.
- Versatility: It accepts all types and formats of data.
- Reproducibility: Syntax files enable users to reproduce results.
- Visualization: Reporting is made more lucid by the results of graphs.
- Comprehensive Documentation: All the steps of analysis are documented to be transparent.
These advantages explain why statistical data analysis with SPSS remains highly preferred in academic and professional environments.
Common Statistical Analyses Performed in SPSS
Researchers use SPSS for a wide range of statistical analyses depending on their research objectives. Common analyses include descriptive statistics, reliability analysis (Cronbach’s Alpha), normality testing, independent and paired t-tests, ANOVA, Chi-square tests, correlation analysis, regression analysis, factor analysis, cluster analysis, survival analysis, and structural equation modeling through IBM SPSS AMOS. These techniques enable researchers to answer diverse research questions with confidence.
Challenges and Limitations
Although it is a versatile method of data analysis using SPSS, the application has several limitations:
- The software can be expensive for individual users.
- It requires a learning curve to interpret outputs correctly.
- Advanced customization options are limited compared to programming tools like R or Python.
Nevertheless, an intuitive structure and comprehensive documentation of SPSS counterbalance most of the difficulties, which contribute to its inclusion into the lists of beginners and experienced workers.
Conclusion
In conclusion, statistical data analysis with SPSS is an essential tool for researchers, analysts, students, and organizations seeking accurate and evidence-based insights. SPSS simplifies complex statistical procedures while maintaining analytical reliability and efficiency.
From descriptive statistics and hypothesis testing to predictive analytics and advanced modeling, SPSS provides a complete environment for modern data analysis. Its user-friendly interface, strong visualization capabilities, automated reporting system, and extensive statistical functions make it one of the most trusted analytical tools worldwide.
Whether conducting academic research, healthcare studies, business forecasting, or market analysis, statistical data analysis with SPSS enables professionals to transform raw data into meaningful knowledge that supports informed decision-making.
Book a free consultation for appointment
Email us at : grow@simbi.in