
Why Research Fails Without Proper Data Analysis: 7 Common Mistakes

A strong research question, appropriate sample and carefully collected data do not guarantee reliable findings. Data analysis in research determines whether evidence supports accurate conclusions. Poor data preparation, inappropriate statistical methods, unchecked assumptions and weak interpretation can lead to misleading results.
For students, researchers and organisations, the key challenge is making sound analytical decisions after data collection. This article highlights seven common data analysis errors and explains how to avoid them.
7 Common Data Analysis Mistakes in Research
Problems can arise at any stage of data analysis. Poor data quality, inappropriate statistical methods, unchecked assumptions and incorrect interpretation can weaken research findings.
1.Poor Data Cleaning
Duplicate records, inconsistent coding and unusual observations can distort results. Check data quality before analysis.
2.Incorrect Missing-Data Handling
Improperly handling missing data can introduce bias and reduce statistical power. Assess the extent and pattern of missing values.
3.Choosing the Wrong Statistical Test
Statistical tests should match the research question, study design, variable types and relevant assumptions.
4.Ignoring Statistical Assumptions
Relevant assumptions, such as distribution, independence, variance and linearity, should be checked before interpreting results.
5.Using a Small or Biased Sample
A small or unrepresentative sample can reduce reliability and limit generalisability. Consider sample size and potential bias during study planning.
6.Misinterpreting P Values
A significant p-value does not necessarily indicate practical importance. Consider effect sizes, confidence intervals and research context.
7.Overfitting Statistical Models
An overfitted model may perform well on existing data but poorly on new data. Appropriate model-building and validation can reduce this risk.
READ THIS: Statistical Data Analysis Services
Table 1. Common Data Analysis Problems and Their Impact on Research Findings
| Analysis problem | Potential impact |
| Poor data cleaning | Distorted statistical results |
| Incorrect missing-data handling | Biased estimates or reduced statistical power |
| Inappropriate statistical test | Misleading conclusions |
| Unchecked assumptions | Unreliable test results |
| Small or biased sample | Limited generalisability |
| Misinterpreted p-values | Incorrect claims about evidence |
| Overfitted models | Poor performance with new data |
Statistical Errors That Alter Research Findings
Choosing the wrong statistical test or ignoring assumptions can produce misleading results. A significant p-value does not always mean practical importance; effect sizes and confidence intervals provide greater context. Correlation should also not be assumed to imply causation.
Data Preparation as a Foundation for Reliable Analysis
Data analysis in research begins before statistical testing. Researchers should verify coding, identify duplicates, examine missing data and investigate unusual values while keeping variable definitions consistent.
For example, in a PhD study with 500 customer-satisfaction responses, identifying 18 duplicate records and missing values before analysis can prevent distorted statistical and regression results. Cleaning the dataset and documenting how problematic records were handled improves the reliability of findings.
Good preparation should include:
- Checking variable coding and measurement levels.
- Identifying duplicates and inconsistent entries.
- Assessing the pattern and extent of missing data.
- Investigating unusual observations and potential outliers.
- Creating a clean analytical dataset while preserving the original data.
Statistical Method Selection Based on Research Design
The analysis technique used will vary depending on the type of study that seeks to establish something. Comparing groups, looking at associations or predicting an outcome and evaluating changes over time are all different objectives and may call for different statistical techniques.
The researchers should take into account the nature of the outcome variable, predictor variables, study design, number of groups, distribution, and assumptions before choosing a test. This stops the common practice of selecting a procedure because it is available in statistical software.
Common Statistical Tests Used in Research
| Research objective | Example | Common statistical approach |
| Compare two independent groups | Treatment group vs control group | Independent-samples t-test |
| Compare two related measurements | Pre-test vs post-test scores | Paired-samples t-test |
| Compare three or more groups | Three treatment groups | ANOVA |
| Examine association between continuous variables | Age and income | Pearson correlation |
| Examine a monotonic or non-parametric association | Ranked variables | Spearman correlation |
| Examine association between categorical variables | Gender and preference | Chi-square test |
| Predict a continuous outcome | Predicting sales from several predictors | Linear regression |
| Predict a binary outcome | Predicting yes/no outcome | Logistic regression |
The appropriate test depends on the research question, study design, variable types and relevant statistical assumptions. The examples above are common approaches rather than universal rules; more complex research designs may require alternative or advanced methods.
Interpreting Statistical Evidence Beyond the P Value
A research finding should not be classified simply as “significant” or “not significant.” Interpretation should consider the effect size, confidence interval, uncertainty and relevance to the research objective. A p-value provides evidence against the null hypothesis but does not indicate the magnitude or practical importance of an effect.
Confidence intervals show the precision of an estimate, while effect sizes indicate the magnitude of a difference or association. A statistically significant result may still have limited practical value if the actual effect is very small.
A Structured Workflow for Reliable Analysis
A systematic workflow strengthens data analysis in research by making analytical decisions easier to track and explain.
Figure 1. Structured Workflow for Reliable Research Data Analysis
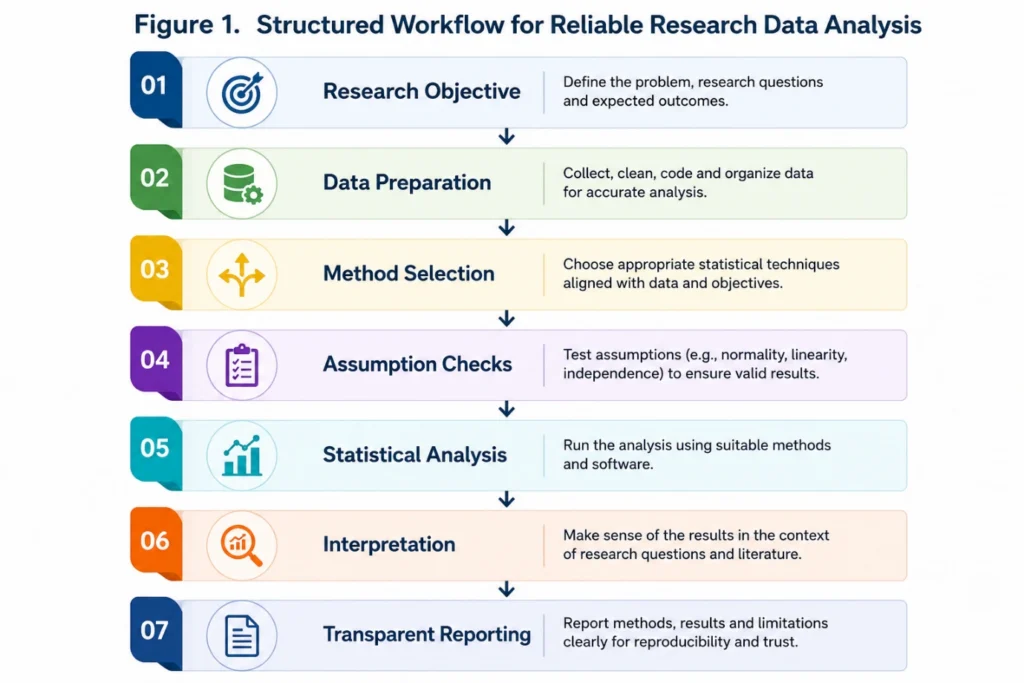
Following this structure reduces avoidable errors and makes the reasoning behind the findings more transparent.
Analytical Tools Used in Modern Research
- SPSS: Suitable for conventional statistical analysis and research data management.
- R: Useful for advanced statistical modelling and reproducible analytical workflows.
- Python: Supports statistical analysis, automation, data processing and predictive modelling.
- Multiple tools: Complex studies may use more than one platform when different tools are better suited to data preparation, statistical modelling or visualisation.
Analysis Quality Across Research Applications
A research paper or thesis can alter its meaning when an improper regression model or a comparison of groups is used in the academic field of research. In health services research, the wrong type of statistics can be misleading in the results of treatment outcomes. Poorly defined models or dirty customer information can result in poor business decisions in business analytics.
In all these contexts, sound conclusions rely on the analytical choices that are consistent with the data and the research aim.
Research Data Analysis Checklist
Before finalising the results of a study, researchers should review the following:
- Define the research question and analytical objectives clearly.
- Confirm variable definitions, coding and measurement levels.
- Check for duplicate, missing, inconsistent and unusual observations.
- Select statistical methods according to the research design and variables.
- Assess relevant assumptions for the selected methods.
- Report effect sizes and confidence intervals where appropriate.
- Document analytical decisions, exclusions and deviations from the original plan.
- Seek statistical expertise when using complex or unfamiliar methods.
Conclusion
Reliable data analysis in research requires more than running statistical tests. It involves preparing the dataset carefully, selecting methods that fit the research question, checking assumptions and interpreting statistical evidence appropriately. These steps determine whether collected data become credible findings or misleading conclusions.
Book a free consultation for appointment
Email us at : grow@simbi.in
Strengthen Your Research with Reliable Data Analysis
If you need support with data cleaning, statistical test selection, advanced analysis, interpretation or research reporting, Simbi Labs can help develop a structured and technically sound analytical approach. Connect with our research experts to strengthen your study and turn your data into defensible research findings.