
How to Use SPSS for Data Analysis: Step-by-Step Beginner Guide
Writing a data analysis using SPSS.
if you are new to SPSS and do not know how to analyze data, then you are in the right place. IBM SPSS Statistics is one of the most popular of the world’s statistical software solutions for analyzing, managing and visualizing data. Whether you are a student, a researcher, a healthcare professional or a business analyst, SPSS can help you to carry out statistical analysis without having to learn advanced programming. This tutorial will introduce you to the SPSS Data Set Preparation, Data Importing, Data Statistical Test, Chart Making and SPSS Data Analysis Results Interpretation through a simple step by step process.
Why SPSS Continues to Be the First Choice for Statistical Analysis
With emerging AI-driven platforms and programming solutions, data analytics is constantly developing, and SPSS continues to be a trusted choice for statistical analysis. It is popular because of its strong analytical capabilities and intuitive interface, which is suitable for both novice and seasoned researchers.
SPSS is designed to analyze data, whereas spreadsheet programs are primarily used to organize data. It helps users to control datasets, run statistical tests, construct visualizations and produce professional reports from a single platform. Tools such as SPSS and Python don’t necessitate programming expertise, with most analysis still being able to be done via a graphical interface.
What Makes SPSS Different from Spreadsheet Software?
Many beginners mistakenly think that Excel and SPSS are the same type of program, due to the rows and columns they are presented in. In fact, they are used for different purposes.
| Spreadsheet Software | SPSS Statistics |
| Designed primarily for organizing data | Designed specifically for statistical analysis |
| A lot of manual calculations | Automated statistical procedures |
| Limited handling of large research datasets | Efficiently manages complex datasets with numerous variables |
| Few resources for hypothesis testing | Advanced statistical models and visualizations |
Real-World Applications of SPSS
SPSS’ best feature is its flexibility, The need for it is widespread in many industries and for various analytical questions.
- Healthcare: Patients’ data is analyzed, treatment efficacy is assessed, disease trends are tracked, and clinical trials are carried out with SPSS.
- Market Research: SPSS is employed by businesses to gauge customer satisfaction, segment their target audience, and assess marketing campaigns.
- Education: Educational institutions review students’ performances, evaluate learning outcomes and do academic research.
- Human Resources: HR professionals assess employee engagement, quantify training effectiveness, understand turnover patterns and measure the satisfaction of the workplace.
- Government: Government agencies interpret census data, conduct public opinion polls, examine economic indicators and assess policy impacts, and use these findings to inform evidence-based decision making.
- Social Sciences: SPSS is a popular tool among researchers in the social sciences for analyzing data and testing hypotheses, as well as for examining relationships between variables.
Before You Open SPSS: Preparing Your Dataset the Right Way
Perhaps the most widely held false belief about data analysis is that insights actually start when the data is imported into SPSS.
The actual quality of an analysis is very much dependent on the quality of the data itself that has been prepared in advance of the analysis. The statistical software is incapable of fixing data that is not well structured.
Even the most sophisticated statistical techniques can lead to inaccurate results if the data contains inconsistent coding, duplicate records, missing responses and/or poorly defined variable names. This is why most analysts spend a lot of time in preparing the data before making any calculations.
- Start with a Well-Structured Dataset: Each dataset must be based on a simple rule:
- Each row should be an observation/respondent/case
- One column should be for each variable.
- Design Clear and Consistent Variable Names: Variable names are used as identifiers during the analysis process. Ambiguous or inconsistent names can sometimes make interpretation difficult, particularly with large datasets.
- Consistency in Data Entry: Consistency is crucial in statistical analysis.
- Recognize missing values early: It is nearly impossible to avoid having missing information in surveys and research studies. Participant answers may be omitted, measurements might not exist or records might be missing.
- Remove Duplicate Records: Eliminating duplicate records will greatly improve the accuracy of the statistical results, as duplicate records will have an undue influence on the result.
- Check Data Accuracy: A common mistake in statistics is that small data entry errors can have a significant impact.
- Think About Your Research Question First: Before starting SPSS, a common problem that novices will encounter is to have no analytical goal in mind for their analysis: Think About Your Research Question First:
- What problem am I trying to solve?
- Which variables are likely to answer this question?
- What type of statistical analysis will be appropriate?
- What decisions will be based on these results?
Getting Comfortable with the SPSS Environment Before You Begin
The sheer number of windows, menus and options in SPSS may be intimidating for those who are new to using the program. The interface, however, is built in such a way that it will help to navigate the user through the entire analytical process. You can save some time and avoid errors when you analyze by understanding the functions of each part before starting the analysis. Don’t think of SPSS as an application, think of it as a workspace with multiple windows with different functions.
1.Data View:
This is the window of your data in the same format as a spreadsheet. A row is an observation (also called a case) and a column is a variable.
This is the main workspace where data is entered, imported and viewed. Records can be quickly scanned to check for unusual values and to ensure that the imported data set is consistent with expectations.
2. Set Up Variables Correctly
Before performing any analysis, review your variables in Variable View.
For each variable:
- Enter a meaningful variable name.
- Choose the correct data type (Numeric, String, Date, etc.).
- Add descriptive labels if needed.
- Assign value labels for categorical variables (for example, 1 = Male, 2 = Female).
- Select the appropriate measurement level (Nominal, Ordinal, or Scale).
3.Output Viewer( Where Results Are Generated):
Every analysis performed in SPSS produces results in the Output Viewer.
4.Syntax Editor (Automating Repetitive Tasks):
Although SPSS is known for its graphical interface, every action performed through the menus can also be recorded as syntax.
The Syntax Editor allows users to:
- Reproduce analyses consistently
- Automate repetitive procedures
- Document analytical workflows
- Share analyses with colleagues
5.Chart Builder (Creating Visual Representations):
Visualizations are an important element to understanding data.
SPSS has a Chart Builder option that can be used to produce histograms, bar charts, scatter plots, box plots, and more. These charts can be useful for detecting trends, patterns and potential outliers that might not be apparent from numerical summaries.
6.Make Sure Your Variables are set up for a Reliable Foundation:
A dataset is as reliable as the variables it has. To perform any statistical analysis, SPSS has to know the properties of each variable. Variable setting is one of the most important steps in the analytical process and if not done correctly, can result in inappropriate statistical tests, misleading summaries, or incorrect conclusions.
7.Assign Meaningful Variable Labels:
Variable names are typically shortened to fit the naming rules, but meaningful labels convey information about the variable used in outputs and reports.
For example:
| Variable Name | Variable Label |
| Sat_Score | Overall Customer Satisfaction Rating |
| Inc_Month | Monthly Household Income |
| Age | Respondent Age (Years) |
8. Identify Value Labels:
There are some categorical variables which are stored as numbers for efficiency.
Choose the Correct Measurement Level
SPSS classifies variables into three measurement levels:
- Nominal: Categories without any order (e.g., department, gender, city)
- Ordinal: Categories with a meaningful order (e.g., satisfaction levels, education level)
- Scale: Continuous numerical values (e.g., age, salary, weight)
Set up Missing Values:
If some values are missing, then they are not observations and should be labelled as such. For instance, in a variable that contains the number 999, which means No Response, the software SPSS should assume that the number 999 is missing from that variable, rather than calculating with it.
Handling of missing data properly avoids biased means and false statistics.
Effective Data Preparation, to enhance accuracy.
The quality of the data leads to the reliability of the data analysis. Incomplete, inconsistent or inaccurate data is not adequate even for the most sophisticated statistical methods.Data preparation is an essential part of the SPSS process, which is why it is one of the most crucial ones.
To conduct any statistical test, you need to make sure that your data is clean, consistent and appropriate for statistical analysis. A good data set will make the results more accurate, and less likely to lead to wrong conclusions.
Discover Hidden Patterns Before Running Statistical Tests
It’s important to know the basics of your data set before testing hypotheses or creating statistical models. Exploratory analysis can detect trends, unusual observations and potential problems that may affect subsequent analyses. It is better to start by summarizing and visualizing data before applying more sophisticated statistical methods.
Create Frequency Distribution: Frequency tables are tables that summarize the number of times each category or value occurs in a set of data.
Compute Descriptive Statistics: Descriptive statistics are summarizations of a numerical variable and/or a snapshot of the dataset.
Common measures include:
| Statistic | Purpose |
| Mean | Average value |
| Median | Middle value |
| Mode | Most frequent value |
| Standard Deviation | Measures variation in the data |
| Minimum & Maximum | Identify the range of values |
Learn about Crosstabs:Crosstabs show the relationship between two categorical variables at the same time.
Data Distribution: Many of the statistical tests make the assumption that the numerical data is normally distributed.
Check the validity of this assumption before deciding on a statistical method.
Use visualization to identify trends: Graphs may show patterns not evident in tables.
Choosing the Right Statistical Technique for Your Research
An essential component of learning to do data analysis in SPSS is choosing the right statistical method. The selection of the wrong test can result in wrong conclusions even after correct calculations are made.
Determine relationships between pairs of variables. Correlation analysis is often employed to find out if two variables are related when the goal is to determine this.
- Pearson Correlation: When both variables are continuous and normally distributed. Spearman correlation: When variables are ordinal, or are not suitable for Pearson correlation. Comparing Groups: In some cases researchers are interested in comparing averages between different groups.
- Independent Samples t-Test: Compare the average values of two groups.
Steps:- Analyze → Compare Means → Independent-Samples T Test
- Select your test variable and grouping variable, then click OK.
- One-Way ANOVA: compares the means of three or more groups that are independent from each other.
- Predicting Outcomes: Prediction models are used to make estimates of the influence of one variable on another variables
- Linear Regression: When predicting a continuous outcome. Logistic Regression: If the outcome variable is a binary (two-sided) variable.
Investigating Relationships between Categorical Data
Chi Square Test: Used to see if two categorical variables are related.
Simplifying Complex Data
Factor Analysis: Large questionnaires may also have several questions that assess the same concept,
Factor analysis allows to classify related variables into smaller dimensions which are easier to interpret.
Measuring Survey Reliability
Cronbach’s Alpha: When interpreting survey results, researchers will often want to determine if questionnaire items are measuring the same concept.
Cronbach’s Alpha is a measure used for assessing internal consistency of survey scales. The higher the number the more reliable the data.
Make sense of statistical output into meaningful information.
The analytical process doesn’t just stop at running statistical tests. The real power of SPSS is the interpretation of results and the translation of results to meaningful conclusions.
Decision makers are not only minded on the statistical terms but rather what the results mean in a real world context.
Understand the p-Value
A typical threshold is:
p < 0.05: Significant result.
p ≥ 0.05: Not enough to reach a decision of significant relationship or difference.
1. Interpret Confidence Intervals:
Confidence intervals give a range of values within which the actual value of the population is expected to fall. Confidence intervals that are narrow tend to be more precise, whereas wider intervals have higher levels of uncertainty.
2. Evaluate Effect Size:
Two studies may have the same p-value and yet be very different in practice. Effect size: a measure indicates the strength or magnitude of a relationship or difference, usually to determine whether a relationship or difference is statistically significant and whether the result is meaningful in real world situations.
3. Read Correlation Coefficients
The correlation coefficient can vary from -1 to +1. a. If the value of the equation is positive, then both variables have a positive correlation. b. If the values are negative, the values of one variable and the other are moving in opposite directions. c. Numbers near 0 indicate little or no linear relationship.
4. Understand R-Squared in Regression
In regression output, the value of R² (R-Squared) is a measure of the proportion of variation in the dependent variable that is explained by the regression model.
Transform Numbers into Effective Information
Report the results of statistics and interpret them in terms of the study. Data analysis using SPSS software.
From Tables to Stories: Visualizing Results in SPSS
Numbers, particularly in large datasets, can be hard to interpret. Visualizations may serve as a tool to help make complex information easier to understand, by showing trends, comparisons and relationships you wouldn’t necessarily notice in the statistics tables. All of the charts created in SPSS will be automatically generated from data in your data set, which will help you communicate your results to researchers, managers, and stakeholders.
The selection of the appropriate chart is as crucial as the choice of appropriate statistical test. Each visualization tells a different story; and the right visualization can help make your analysis more meaningful.
Common SPSS Charts and Their Uses
| Chart Type | Purpose | Best Used For |
| Histogram | Displays the distribution of continuous data by grouping values into intervals. It helps assess normality and identify skewness or unusual patterns. | Age distribution, income distribution, test scores, blood pressure measurements |
| Bar Chart | Compares frequencies, counts, or average values across different categories, making it ideal for categorical data analysis. | Customer satisfaction by department, product preferences, employee distribution across teams |
| Pie Chart | Shows how individual categories contribute to a whole, making it easy to compare proportions. | Market share, gender distribution, device usage percentages |
| Scatter Plot | Illustrates the relationship between two continuous variables and helps identify trends, patterns, or correlations. | Advertising expenditure vs. sales, study hours vs. examination scores, height vs. weight |
| Boxplot | Summarizes the distribution of numerical data while highlighting the median, spread, and potential outliers. | Salary comparison across departments, patient recovery times, customer spending patterns |
| Line Chart | Displays changes or trends over a period of time by connecting data points with lines. | Monthly sales, website traffic, stock prices, production output |
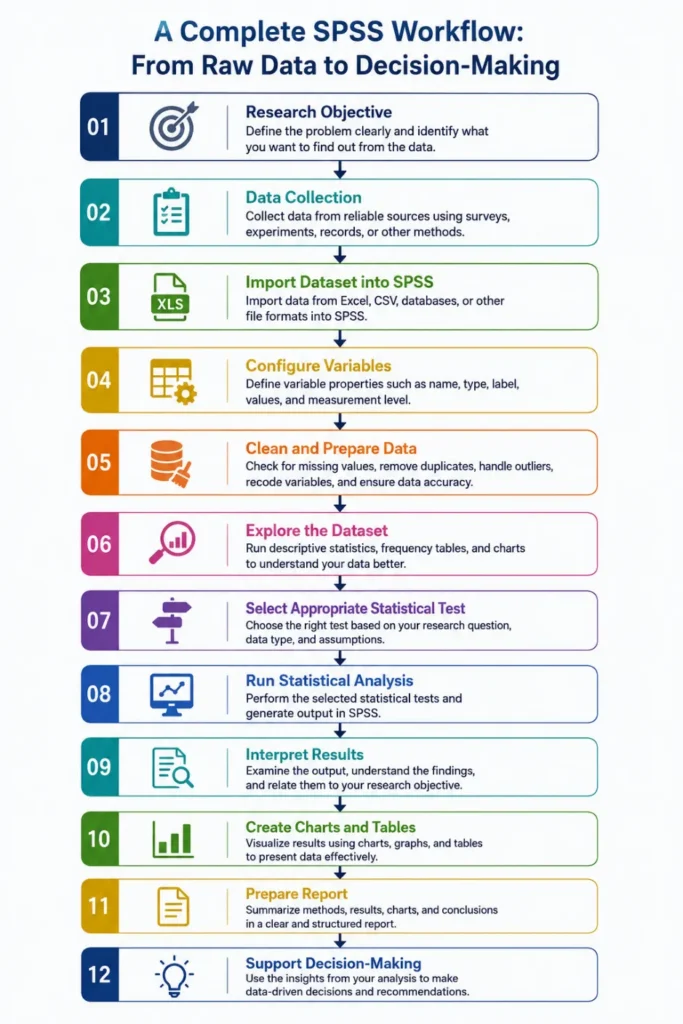
Some errors that can affect your SPSS analysis are:
Even the most advanced analysts can make errors that can impact the results’ validity. Knowing about these common pitfalls can help make your analysis better.
- Selecting the Wrong Statistical Test: Each statistical test is used to address a particular type of research question. The wrong test applied may lead to incorrect conclusions.
- Failure to make statistical assumptions: Many statistical techniques are based on assumptions, such as those pertaining to normality, independence, and equal variances.
- Inconsistent Data Coding: If data is coded in different ways, then it is likely that it will be analyzed and summarized in an incorrect manner.
- The great error of Missing Values: Missing values should not be ignored. Depending on the number and the distribution of the missing data, they can have a major impact on statistics.
- The pitfalls of misinterpreting p-values: A statistically significant result does not mean a result that is of practical significance. However, a non-significant result does not necessarily mean that there is no relationship. When interpreting, the context of the research is always a factor to take into account.
- Outliers: Extreme values can affect averages, correlation and regression models. Before determining whether to retain or remove outliers, always look at them.
Which Statistical Test Should You Use?
| If you want to… | Use this SPSS Test |
| Summarize your data | Descriptive Statistics |
| Compare two groups | Independent Samples t-Test |
| Compare three or more groups | One-Way ANOVA |
| Measure relationship between variables | Pearson Correlation |
| Compare categorical variables | Chi-Square Test |
| Predict outcomes | Linear Regression |
Example: Analyzing Student Exam Scores in SPSS
What is the purpose of the teacher’s study if she is interested in finding out if there is any difference between the performance of male and female students in an examination?
- Import the student data into SPSS.
- Select the desired test variable (Exam Score).
- Select Gender as the GROUPING VARIABLE.
- On the Analyze menu, select Compare Means → Independent-Samples T Test.
- Press OK to display the results
.If the p-value is less than 0.05, the difference in average scores between male and female students is considered statistically significant.
How Different Industries Use SPSS
SPSS is one of the most popular statistical software packages across various industries due to its versatility. It is useful whenever it is needed to make decisions based on evidence, as it can process structured data and generate statistical information accurately.
| Industry | Common Applications |
| Healthcare | Clinical research, patient outcome analysis, epidemiological studies |
| Market Research | Customer satisfaction surveys, brand analysis, consumer behavior |
| Education | Student performance evaluation, educational research |
| Human Resources | Employee engagement, retention analysis, workforce planning |
| Banking & Finance | Customer segmentation, risk assessment, forecasting |
| Government | Census analysis, policy evaluation, demographic research |
| Manufacturing | Quality control, process improvement, defect analysis |
| Pharmaceuticals | Clinical trials, drug efficacy studies |
| Social Sciences | Behavioral studies, psychological research, survey analysis |
Is SPSS still a contender in the age of Artificial Intelligence?
While AI and machine learning have revolutionized data analysis, SPSS continues to be a valuable tool. The most significant advantage of SPSS is its statistical transparency, unlike many AI models, SPSS generates results that are easily interpretable and validated, making it a trusted tool in various research, healthcare, and government applications.
Predictive analytics is also a feature of today’s SPSS versions, and there are also Python and R compatibility features, which enable users to integrate traditional statistical approaches with advanced analytic ones. AI is not an alternative to SPSS, but rather an complement, as SPSS is a fundamental tool for data analysis and ensuring reliability and evidence.
Frequently Asked Questions
Can SPSS be used by beginners?
Yes. SPSS is an easy to use program that does not require extensive programming skills for beginners to use and perform statistical analysis.
Is SPSS coding-free?
Yes. For most statistical analyses there is no need to type in formulas in SPSS’s graphical interface.
Which kind of files SPSS can import?
SPSS can import data from Excel, CSV, SQL databases, and other text formats.
Which are the industries where SPSS is commonly used?
SPSS has become a popular program in the healthcare, educational, market research, business analysis, and government sectors, as well as in research focused on the social sciences.
Which is better, SPSS or Excel for statistical analysis?
SPSS has more powerful statistical tests, data visualization and analysis tools for researchers and professional analysis, while Excel is suitable for simple calculation and data management.
Mastering Data Analysis with SPSS Starts with the Right Workflow
By understanding how to navigate and use SPSS for data analysis, you can make informed decisions about your data and draw meaningful conclusions. The simplicity of the SPSS user-friendly interface makes the entire analytical process easy from importing datasets, preparing variables, conducting statistical tests to interpreting the results. From academic research to business analysis, healthcare studies to market research, understanding SPSS can give you the power to make accurate data-driven decisions and enhance the quality of your work.
Book a free consultation for appointment
Email us at : grow@simbi.in