
KPI Dashboards and Business Intelligence for Companies
Introduction
In the current competitive business environment, businesses require real-time information to make informed, smart decisions. That’s where KPI dashboards and company BI for companies are vital. Businesses can make sense of the data, gain insights, and make informed decisions based on its visual representation, which allows them to monitor performance, track goals, and enhance overall efficiency.
For businesses, implementing KPI dashboards and Business Intelligence can help with data-driven decision making, regardless of whether you are a startup or a big enterprise.
What Are KPI Dashboards and Business Intelligence?
KPI dashboards and business intelligence for companies refer to tools and systems that collect, analyze, and visualize business data to support strategic decision-making.
Key Components:
1. KPI Dashboards
Examples of KPIs:
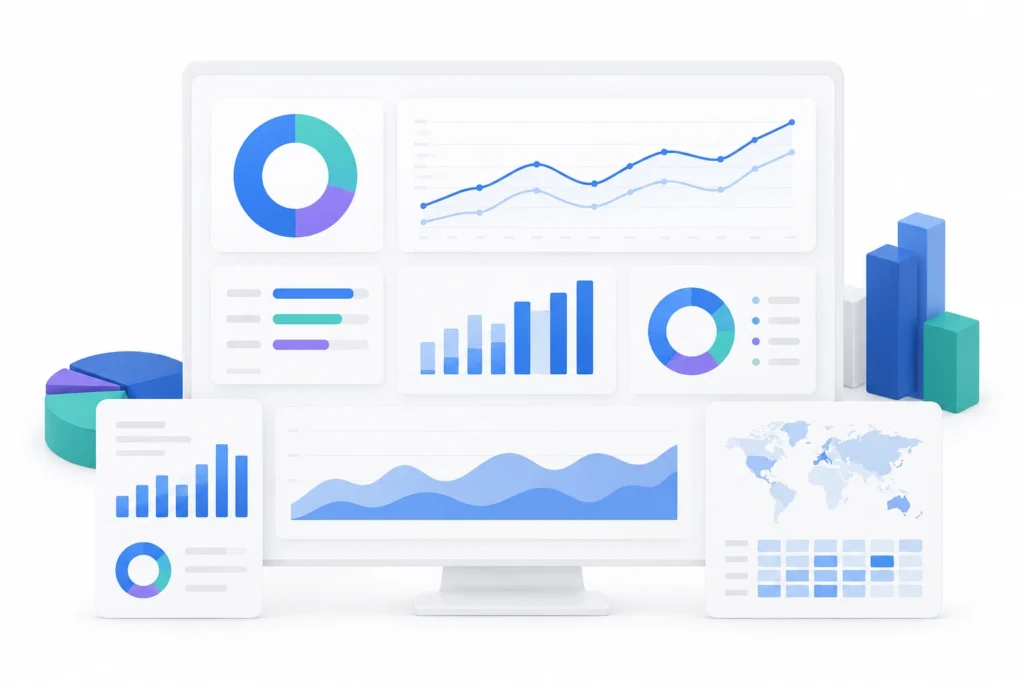
KPI (Key Performance Indicator) dashboards display critical metrics in a visual format such as charts, graphs, and tables.
- Sales growth
- Customer acquisition cost
- Conversion rate
- Employee productivity
2. Business Intelligence (BI)
Business Intelligence involves technologies and processes used to analyze data and generate insights.
BI Includes:
- Data integration
- Data warehousing
- Reporting and analytics
- Data visualization
Together, KPI dashboards and business intelligence for companies provide a complete view of organisational performance.
Why KPI Dashboards and Business Intelligence Matter
1. Real-Time Decision-Making
Businesses can access live data and respond quickly to changes.
2. Improved Performance Tracking
Organizations can monitor KPIs and measure progress toward goals.
3. Enhanced Data Visibility
Data is presented in an easy-to-understand format.
4. Increased Efficiency
Automated reporting reduces manual work.
5. Better Strategic Planning
Insights help in long-term planning and forecasting.
Types of KPI Dashboards
1. Operational Dashboards
Focus on day-to-day activities.
Example:
Monitoring daily sales and inventory levels.
2. Strategic Dashboards
Track long-term goals and performance.
Example:
Annual revenue growth and market share.
3. Analytical Dashboards
Provide in-depth analysis and trends.
Example:
Customer behavior analysis and segmentation.
Key Features of Business Intelligence Solutions
Data Integration
Combines data from multiple sources into one platform.
Interactive Visualisations
Users can explore data through dynamic charts and dashboards.
Custom Reporting
Tailored reports based on business needs.
Predictive Analytics
Forecast future trends using historical data.
Cloud-Based Access
Access dashboards anytime, anywhere.
These features make KPI dashboards and business intelligence for companies essential for modern organisations.
Business Use Cases
1. Sales and Marketing
Companies use KPI dashboards and business intelligence for companies to track campaign performance and sales metrics.
Example:
A company monitors conversion rates and adjusts marketing strategies accordingly.
2. Finance
Finance teams use dashboards to track revenue, expenses, and profitability.
Example:
Analyzing monthly financial performance to control costs.
3. Human Resources
HR departments use BI tools to monitor employee performance and retention.
Example:
Tracking employee turnover rates and satisfaction levels.
4. Operations
Operations teams optimize processes using real-time data.
Example:
Monitoring supply chain efficiency and reducing delays.
Popular Tools for KPI Dashboards and BI
1. Power BI
Widely used for interactive dashboards and reporting.
2. Tableau
Known for advanced data visualisation capabilities.
3. Google Data Studio
Free tool for creating customisable dashboards.
4. QlikView
Offers powerful data analytics and visualisation.
These tools support effective KPI dashboards and business intelligence for companies.
Benefits of KPI Dashboards and Business Intelligence
1. Data-Driven Decision Making
Organizations rely on insights rather than intuition.
2. Faster Reporting
Automated dashboards save time.
3. Improved Accuracy
Reduces human errors in reporting.
4. Better Collaboration
Teams can share insights easily.
5. Competitive Advantage
Businesses can respond quickly to market changes.
How to Implement KPI Dashboards and BI
Step 1: Define Business Goals
Identify key objectives and KPIs.
Step 2: Collect and Integrate Data
Gather data from various sources.
Step 3: Choose the Right Tools
Select BI tools based on your needs.
Step 4: Design Dashboards
Create user-friendly and interactive dashboards.
Step 5: Monitor and Optimize
Continuously update and improve dashboards.
Challenges and Solutions
Challenge 1: Data Quality Issues
Solution: Implement proper data cleaning processes.
Challenge 2: Lack of Expertise
Solution: Work with experienced BI professionals.
Challenge 3: High Implementation Costs
Solution: Start with scalable and cloud-based solutions.
Future Trends in KPI Dashboards and BI
1. AI-Powered Analytics
Automated insights and predictions.
2. Real-Time Data Processing
Instant access to updated information.
3. Self-Service BI
Users can create their own reports without technical expertise.
4. Mobile Dashboards
Access data on smartphones and tablets.
Conclusion
To summarize, business intelligence (BI) dashboards and company KPIs are crucial instruments for contemporary enterprises striving to make savvy, data-driven choices. These solutions offer instant insights, optimize operations, and boost strategic decision-making, enabling businesses to reach their objectives.
Investing in KPI dashboards and business intelligence for companies can completely revolutionize the way companies analyze and leverage their data, whether they are small businesses or large enterprises.
Call to Action
Looking to take your data to the next level? Get ahead of the curve of companies by having KPI dashboards and business intelligence for businesses today, which will help you make smarter decisions for future success.
Book a free consultation for appointment
Email us at : grow@simbi.in