
Independent T-Test in SPSS: A Complete Guide with Examples
The Independent T-Test is one of the most widely used statistical tests in research and data analysis. It is used to compare the means of two independent groups to determine whether a statistically significant difference exists between them.
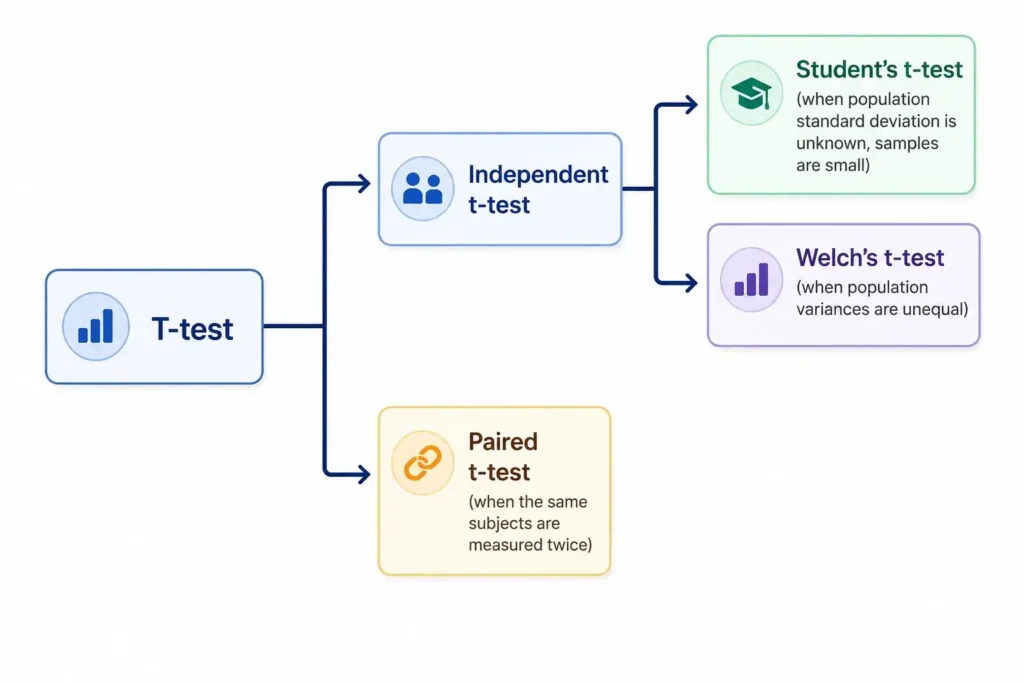
This test is also known as:
- Independent Samples T-Test
- Two-Sample T-Test
- Unpaired T-Test
The independent t-test is commonly used in healthcare, education, psychology, business analytics, and social science research.
What is an Independent T-Test?
An independent t-test is a parametric statistical test used to compare the means of two unrelated groups.
The purpose of the test is to determine whether the difference between the group means is statistically significant or occurred simply due to random variation.
Unlike the paired t-test, the independent t-test compares two completely separate groups.
Examples of Independent T-Test
Example 1: Gender Comparison
A researcher wants to compare exam scores between:
- Male students
- Female students
Since the two groups are independent, an independent t-test is appropriate.
Example 2: Treatment vs Control Group
A doctor compares blood pressure levels between:
- Patients receiving medication
- Patients receiving placebo
Again, the groups are unrelated.
Example 3: Teaching Method Comparison
A teacher compares student performance between:
- Traditional teaching method
- Online teaching method
The students belong to different groups, so the independent t-test is suitable.
Why is Independent T-Test Important?
The independent t-test helps researchers determine whether observed differences between groups are meaningful.
It is useful for:
- Comparing treatments
- Evaluating interventions
- Analyzing group performance
- Supporting research conclusions
When to Use an Independent T-Test
Use an independent t-test when:
- You have two separate groups
- The dependent variable is continuous
- The independent variable has two categories
- Data is approximately normally distributed
Situations Where Independent T-Test is Used
Medical Research
- Comparing cholesterol levels between smokers and non-smokers
- Comparing recovery times between treatment groups
Education
- Comparing marks between male and female students
- Comparing teaching strategies
Business Analytics
- Comparing employee productivity across departments
- Comparing customer satisfaction between branches
Psychology
- Comparing stress levels between working professionals and students
Difference Between Independent and Paired T-Test
| Feature | Independent T-Test | Paired T-Test |
| Groups | Separate groups | Same group measured twice |
| Dependency | Independent observations | Related observations |
| Example | Male vs Female | Before vs After |
Assumptions of Independent T-Test
Before performing the independent t-test, certain assumptions must be checked.
1. Independent Groups
The two groups should be unrelated.
Example:
- One participant cannot belong to both groups.
2. Continuous Dependent Variable
The outcome variable should be numerical.
Examples
- Weight
- Blood pressure
- Test scores
- Income
3. Normality
The dependent variable should approximately follow a normal distribution within each group.
This can be checked using:
- Histogram
- Q-Q Plot
- Shapiro-Wilk Test
4. Homogeneity of Variance
The variances of the two groups should be approximately equal.
This assumption is tested using:
- Levene’s Test for Equality of Variances
Formula of Independent T-Test
The independent t-test compares the difference between group means relative to variability.
The formula is:
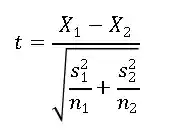
Where:
- X̄₁ = Mean of Group 1
- X̄₂ = Mean of Group 2
- s₁² = Variance of Group 1
- s₂² = Variance of Group 2
- n₁ = Sample size of Group 1
- n₂ = Sample size of Group 2
Hypotheses of Independent T-Test
Null Hypothesis (H₀)
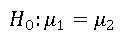
There is no significant difference between the group means.
Alternative Hypothesis (H₁)
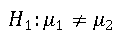
There is a significant difference between the group means.
Example Dataset
A researcher wants to compare exam scores between male and female students.
| Student | Gender | Score |
| A | Male | 75 |
| B | Male | 80 |
| C | Male | 78 |
| D | Male | 82 |
| E | Male | 76 |
| F | Female | 85 |
| G | Female | 88 |
| H | Female | 84 |
| I | Female | 90 |
| J | Female | 87 |
Step-by-Step Independent T-Test in SPSS
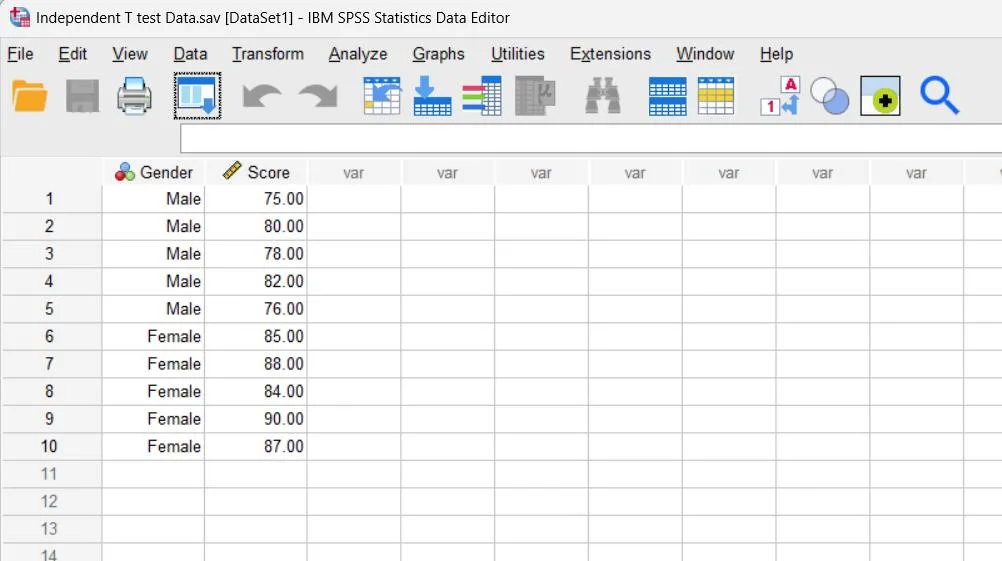
Step 1: Enter Data in SPSS
Create two variables:
- Gender
- Score
Example coding:
- 1 = Male
- 2 = Female
Enter all observations in SPSS Data View.
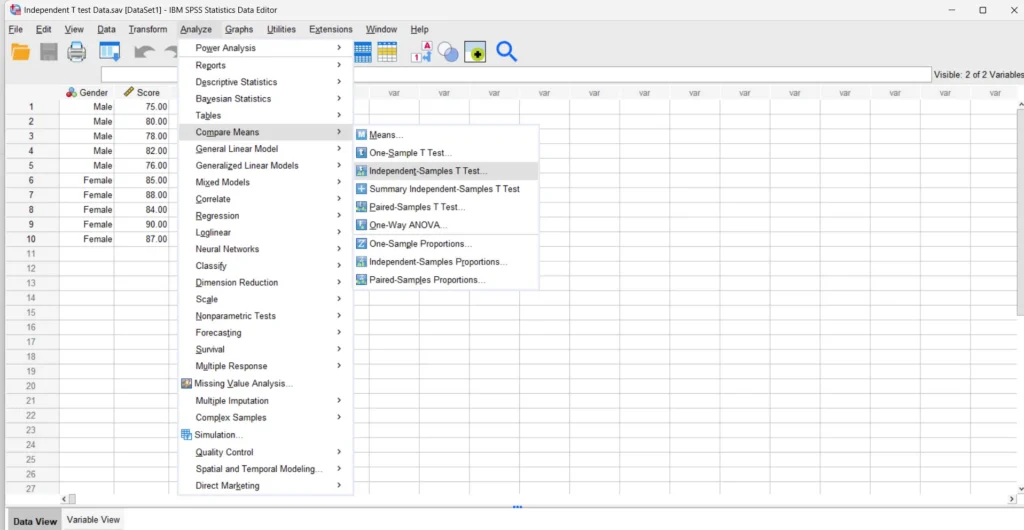
Step 2: Run Independent T-Test
Go to:
Analyze → Compare Means → Independent-Samples T Test
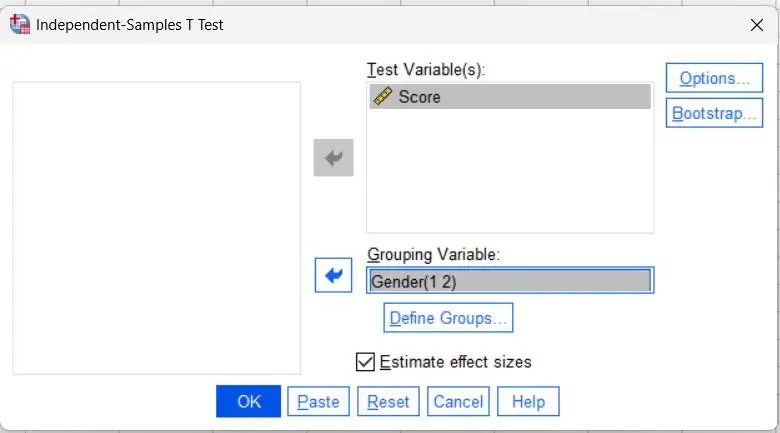
Move:
- Score → Test Variable
- Gender → Grouping Variable
Click:
- Define Groups
- Group 1 = 1
- Group 2 = 2
Click OK.
Step 3: Interpret SPSS Output
1. Group Statistics Table
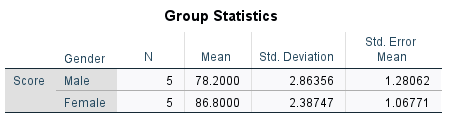
The Group Statistics table shows that female students (Mean = 86.8) scored higher on average than male students (Mean = 78.2). The standard deviations are relatively small, indicating that the scores in both groups are closely distributed around their respective means.
2. Independent Samples Test Table
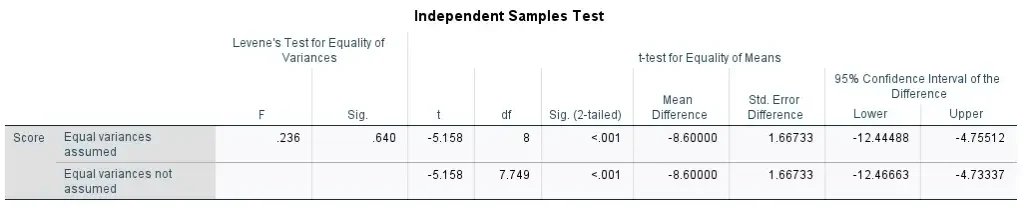
Interpretation of Independent T-Test Results
The independent t-test results indicate a statistically significant difference in exam scores between male and female students. Female students achieved higher mean scores (M = 86.8) compared to male students (M = 78.2).
Levene’s Test for Equality of Variances was not significant (p = 0.640 > 0.05), indicating that the assumption of equal variances was satisfied. Therefore, the “Equal variances assumed” row was used for interpretation. The t-test result was statistically significant, t(8) = -5.158, p < 0.001, showing that the difference in scores between the two groups was unlikely due to random chance.
Conclusion
The independent t-test results indicate a statistically significant difference in exam scores between male and female students. Female students scored significantly higher than male students.
Understanding Levene’s Test
SPSS automatically provides Levene’s Test for Equality of Variances. Levene’s Test is used to check whether the variances of the two groups are equal. This assumption is important in an independent t-test because it helps determine which row of the SPSS output should be interpreted.
Interpretation
| p-value | Decision |
| p > 0.05 | Equal variances assumed |
| p ≤ 0.05 | Equal variances not assumed |
In this example, the significance value of Levene’s Test is 0.640, which is greater than 0.05. Therefore, the assumption of equal variances is satisfied, and the “Equal variances assumed” row is used for interpreting the independent t-test results.
Checking Assumptions in SPSS
Step 1: Check Normality
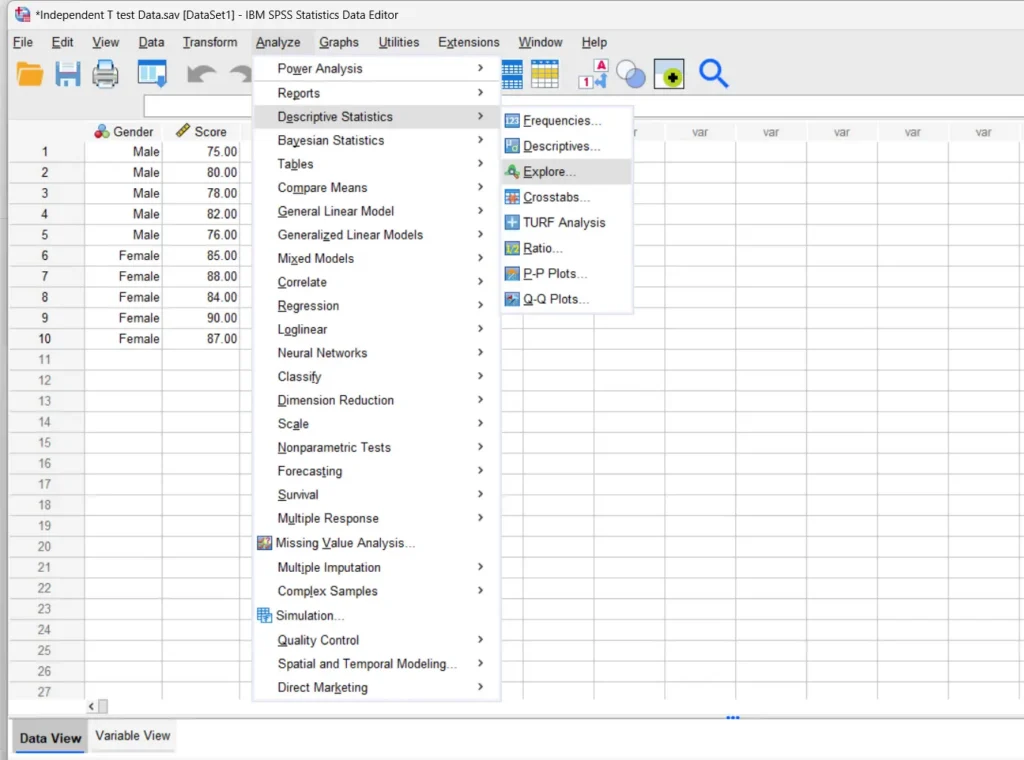
Go to:
Analyze → Descriptive Statistics → Explore
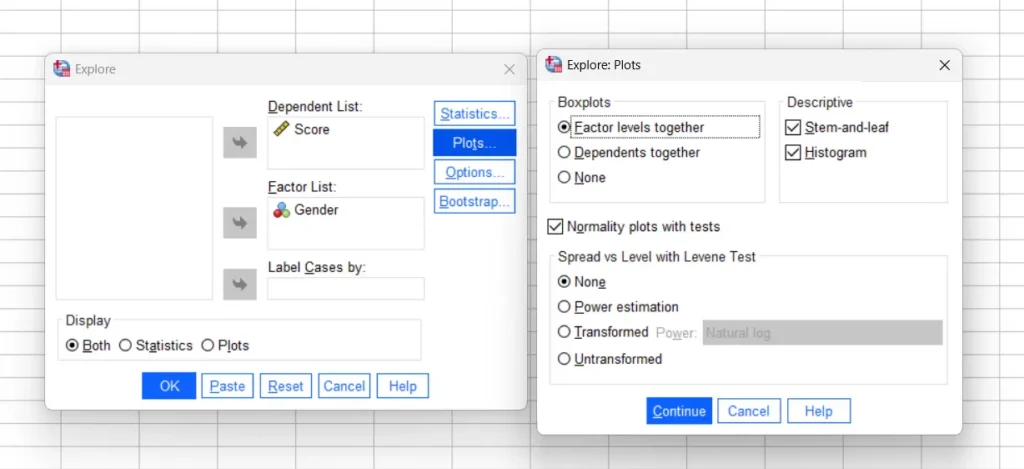
Move:
- Score → Dependent List
- Gender → Factor List
Under Plots:
- Check Histogram
- Check Normality Plots with Tests
Step 2: Interpret Shapiro-Wilk Test
| p-value | Interpretation |
| p > 0.05 | Normality assumption satisfied |
| p ≤ 0.05 | Normality violated |
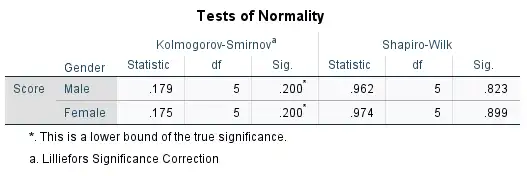
Interpretation of Shapiro-Wilk Test
The Shapiro-Wilk test was used to assess the normality of the score distribution for both male and female groups. Since the significance values for males (p = 0.823) and females (p = 0.899) are greater than 0.05, the normality assumption is satisfied for both groups. Therefore, the independent t-test can be appropriately performed on this dataset.
What If Assumptions Are Violated?
If assumptions are violated, use a nonparametric alternative.
Mann-Whitney U Test
Go to:
Analyze → Nonparametric Tests → Legacy Dialogs → 2 Independent Samples
Select:
- Mann-Whitney U Test
Advantages of Independent T-Test
- Simple to perform
- Easy interpretation
- Widely used in research
- Suitable for comparing two groups
Limitations of Independent T-Test
- Sensitive to outliers
- Assumes normality
- Only compares two groups
Independent T-Test in Different Software
Researchers commonly perform independent t-tests using:
- SPSS
- R Programming
- Python
- Excel
- SAS
- Stata
SPSS is one of the most beginner-friendly software tools for performing independent t-tests.
Independent T-Test vs ANOVA
| Feature | Independent T-Test | ANOVA |
| Number of Groups | Two | Three or More |
| Example | Male vs Female | Male vs Female vs Other |
Conclusion
The independent t-test is one of the most important statistical tools for comparing two independent groups. It is widely used in academic research, healthcare studies, psychology, education, and business analytics.
When assumptions are properly checked, the independent t-test provides accurate and reliable conclusions about group differences.
For better understanding and hands-on practice, the sample dataset and SPSS output used in this analysis are also provided for reference.
Book a free consultation for appointment
Email us at : grow@simbi.in