
How to Do Meta-Analysis in RevMan: A Complete Step-by-Step Guide
Meta-analysis in RevMan (Review Manager) is a widely used method for combining evidence from multiple studies into a statistically supported conclusion. It provides a structured environment for entering study data, selecting appropriate statistical models, and generating forest and funnel plots without coding. This guide explains the complete RevMan meta-analysis process, including the underlying statistics, comparisons of continuous and dichotomous outcomes, and two worked case studies with calculations and interpretation that can be applied to your own dataset.
What Is RevMan and Why It Matters for Evidence Synthesis
RevMan is the software developed and maintained by Cochrane for preparing and maintaining systematic reviews of interventions, diagnostic test accuracy studies and methodology reviews. It is free to use, widely accepted by journals and regulatory bodies, and purpose-built for the type of aggregate data that most systematic reviews rely on.
Researchers turn to RevMan for meta-analysis rather than general-purpose statistical software for a few practical reasons:
- It is designed specifically for systematic review workflows, from study eligibility screening through to the final synthesis.
- Forest plots and funnel plots are generated directly from entered data, with formatting that matches journal and Cochrane Library standards.
- Both fixed-effect and random-effects models are built in, along with the heterogeneity statistics (I², Chi², Tau²) needed to justify the choice.
- It supports subgroup analysis, sensitivity analysis and risk-of-bias summary figures within the same file.
Because of this, RevMan for meta-analysis has become close to a default choice in health and social sciences research, particularly where the review will eventually be submitted to Cochrane or a peer-reviewed journal that expects a Cochrane-style forest plot.
READ MORE: Top Statistical Data Analysis Tools in 2026
Core Statistical Concepts Before You Begin
A meta-analysis is only as sound as the decisions made before any data is entered. Three choices matter most in RevMan: the effect measure, the analysis model, and how heterogeneity is assessed.
Choosing an Effect Measure
The effect measure depends entirely on the type of outcome data extracted from the included studies.
- Continuous outcomes (e.g., a symptom score, blood pressure, length of stay): Mean Difference (MD) when all studies use the same scale, or Standardized Mean Difference (SMD) when studies use different scales measuring the same construct.
- Dichotomous outcomes (e.g., presence or absence of an event): Risk Ratio (RR), Odds Ratio (OR), or Risk Difference (RD).
Selecting the wrong measure is one of the most common errors in a RevMan meta-analysis, and it is worth confirming this before any comparison is created.
Fixed-Effect vs. Random-Effects Models
A fixed-effect model assumes every included study is estimating exactly the same true effect, with observed differences due only to sampling error. A random-effects model assumes the true effect varies across studies and estimates the average of a distribution of effects.
In practice, random-effects models are the more defensible default whenever the included studies differ in population, setting, dosage or follow-up duration, which is true of most real-world evidence syntheses. Both case studies in this guide use the random-effects (DerSimonian-Laird) model available in RevMan.
Interpreting Heterogeneity: I², Chi² and Tau²
Heterogeneity statistics tell you how much the studies actually agree with one another, independent of the pooled effect itself.
- I² describes the percentage of total variation across studies that is due to genuine differences between them rather than chance. Values below roughly 25% are usually considered low, 25–75% moderate, and above 75% substantial.
- Chi² (Cochran’s Q) tests whether observed differences between studies are greater than would be expected by chance alone.
- Tau² estimates the variance of true effects across studies and is used directly by the random-effects model to reweight each study.
Forest Plots and Funnel Plots
A forest plot displays each study’s effect estimate and confidence interval as a horizontal line, with a diamond at the bottom representing the pooled effect. A funnel plot plots each study’s effect size against its standard error (or precision); in the absence of publication bias or small-study effects, the points should scatter roughly symmetrically around the pooled estimate, forming an inverted funnel shape.
Use RevMan for Meta-Analysis: The Standard Workflow
Regardless of whether the outcome is continuous or dichotomous, every meta-analysis revman project follows the same five-stage workflow inside the software:
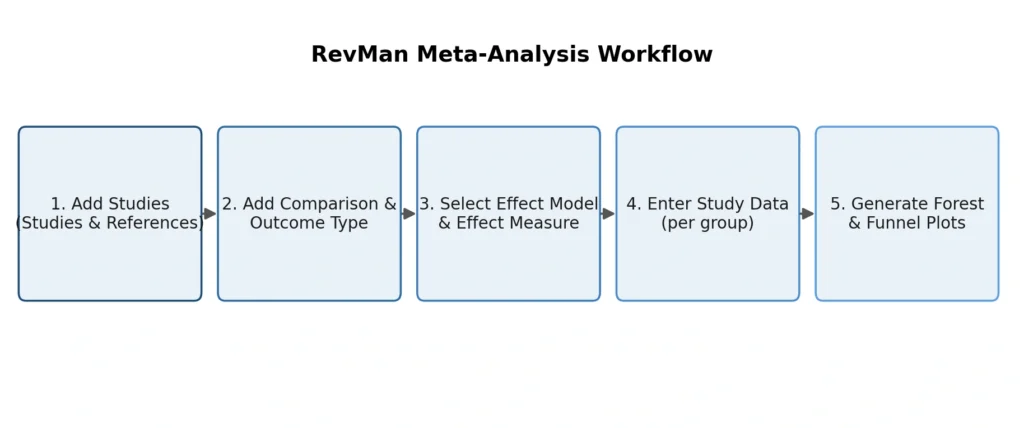
Figure 1: The standard workflow for running a meta-analysis in RevMan, from study entry to plot generation.
- Add Included Studies: Open the Studies and References section and click Add Study to enter each study’s ID (typically first author and year), then add full citation details.
- Create a Comparison: Move to the Data and Analyses tab, click Add Comparison, name the outcome, and select whether the data are Continuous, Dichotomous, or another supported type.
- Select the Model and Effect Measure: Choose Fixed or Random effects, then select the effect measure appropriate to the data type (SMD/MD for continuous, RR/OR/RD for dichotomous).
- Enter Study Data: For continuous data, enter the mean, standard deviation and total sample size for each group in every study. For dichotomous data, enter the number of events and the total sample size for each group.
- Generate the Forest and Funnel Plots: Under the Figures tab, select Add Figure, choose Forest Plot or Funnel Plot, select the relevant outcome, and click Finish to generate the plot automatically from the entered data.
The two worked examples below apply this exact sequence, first to a continuous outcome and then to a dichotomous one, so you can see how the same five steps adapt to each data type.
Part A: Meta-Analysis for Continuous Data in RevMan
Case Study 1
Research Question: Does Mindfulness-Based Stress Reduction (MBSR) lower anxiety scores compared with usual care in adults with generalised anxiety?
Data:
| Study ID | n (MBSR) | Mean (MBSR) | SD (MBSR) | n (Usual Care) | Mean (Usual Care) | SD (Usual Care) |
| Anand 2019 | 45 | 18.2 | 4.1 | 44 | 22.6 | 4.4 |
| Bertrand 2020 | 60 | 19.0 | 4.6 | 58 | 23.1 | 4.9 |
| Chowdhury 2018 | 38 | 17.5 | 3.8 | 40 | 21.4 | 4.0 |
| Delgado 2021 | 72 | 18.8 | 4.3 | 70 | 22.9 | 4.6 |
| Esposito 2017 | 50 | 19.4 | 4.5 | 52 | 23.6 | 4.8 |
| Farouk 2022 | 65 | 18.0 | 4.0 | 63 | 22.0 | 4.2 |
| Gupta 2020 | 55 | 19.6 | 4.7 | 54 | 23.9 | 5.0 |
| Hoffman 2019 | 80 | 18.5 | 4.2 | 78 | 22.5 | 4.5 |
Data Description: The dataset summarises results from eight randomised trials comparing post-intervention anxiety scores between an MBSR group and a usual-care control group, each reporting sample size, mean score and standard deviation for both arms. Lower scores indicate lower anxiety.
Step-by-Step: Continuous Data Meta-Analysis in RevMan
Step 1: Add the Included Studies
Open Studies and References and use Add Study to enter each of the eight studies (Anand 2019 through Hoffman 2019) with its citation details.
Step 2: Create the Comparison
In the Data and Analyses tab, click Add Comparison, name the outcome “Anxiety Score” and select Continuous as the outcome type.
Step 3: Select the Model and Effect Measure
Choose the Random Effects model and Standardized Mean Difference as the effect measure, since the eight trials use slightly different anxiety rating scales.
Step 4: Enter the Study Data
For each study, enter the mean, standard deviation and total sample size for both the MBSR group and the usual-care group, exactly as listed in the data table above.
Step 5: Generate the Forest Plot
Under the Figures tab, select Add Figure, choose Forest Plot, select the Anxiety Score outcome, and click Finish.
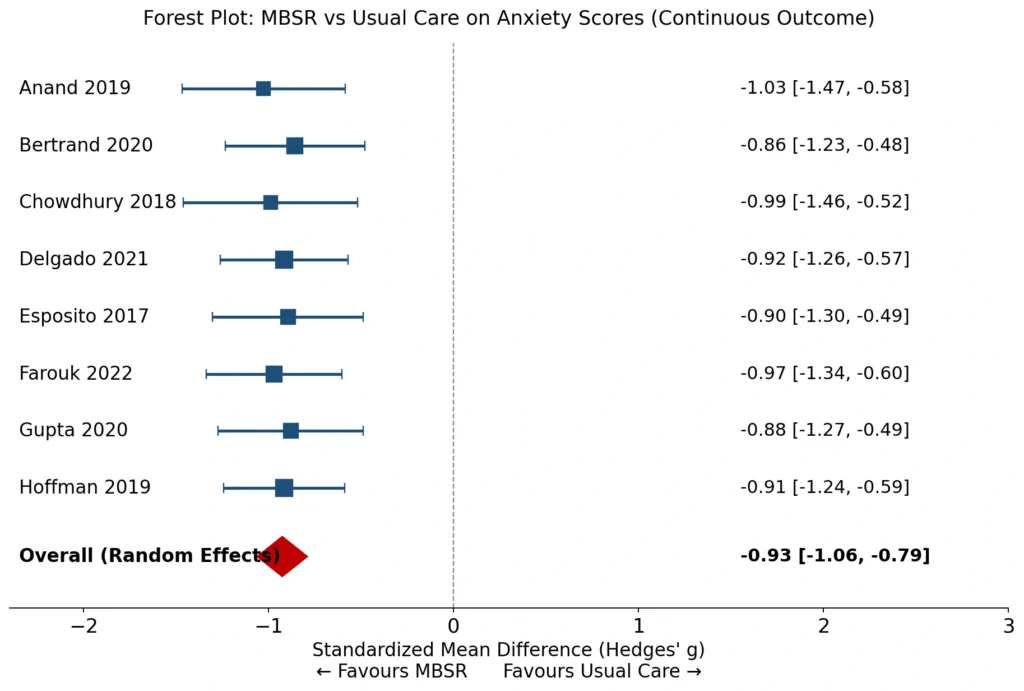
Figure 2: Forest plot for the continuous outcome (anxiety scores), MBSR vs. usual care.
All eight studies show a negative Hedges’ g, meaning anxiety scores were consistently lower in the MBSR group, and none of the individual confidence intervals cross zero. The pooled random-effects estimate is g = -0.93 (95% CI: -1.06 to -0.79), a large and statistically significant effect (Z = -13.37, p < 0.00001). Heterogeneity is negligible (I² = 0%, Chi² = 0.53, df = 7, p = 1.00, Tau² ≈ 0), indicating the eight trials are estimating a highly consistent underlying effect.
Step 6: Generate the Funnel Plot
Repeat the Add Figure process, this time selecting Funnel Plot for the same outcome.
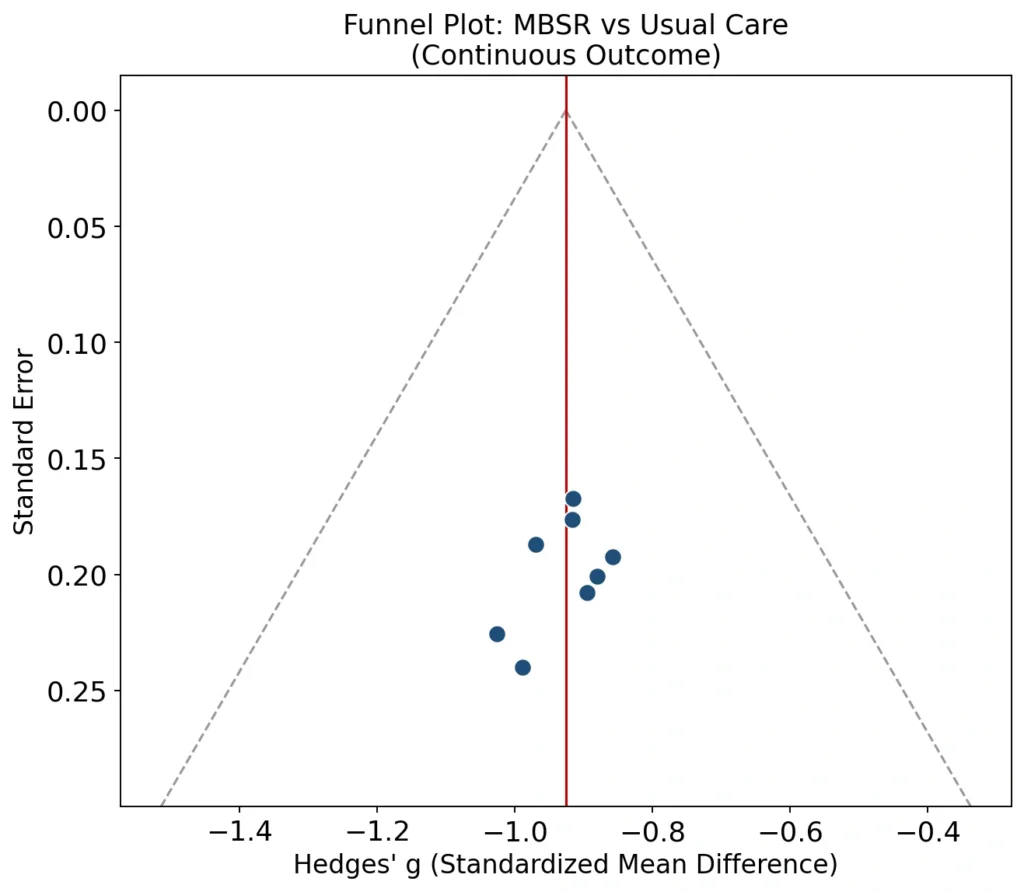
Figure 3: Funnel plot for the continuous outcome, checking for small-study effects and publication bias.
The eight studies are distributed roughly symmetrically on either side of the pooled effect line, with no obvious clustering of small studies at the extremes. This pattern gives no strong visual indication of publication bias, though with only eight studies a formal Egger’s test would be needed to confirm this statistically.
Part B: Meta-Analysis for Dichotomous Data in RevMan
Case Study 2
Research Question: Does an early mobilization protocol reduce the risk of post-operative pneumonia compared with standard post-surgical care?
Data:
| Study ID | Pneumonia Events (Early Mobilization) | Total (Early Mobilization) | Pneumonia Events (Standard Care) | Total (Standard Care) |
| Ibrahim 2018 | 9 | 111 | 21 | 109 |
| Johansen 2020 | 12 | 108 | 24 | 106 |
| Kapoor 2019 | 7 | 95 | 18 | 97 |
| Lindqvist 2021 | 14 | 120 | 27 | 118 |
| Mensah 2017 | 6 | 88 | 16 | 90 |
| Nakamura 2022 | 11 | 102 | 22 | 100 |
| Okafor 2019 | 8 | 96 | 19 | 98 |
| Patel 2020 | 13 | 115 | 25 | 113 |
Data Description: The dataset reports post-operative pneumonia events from eight trials comparing an early mobilization protocol against standard care, with the number of events and total participants recorded for each arm.
Step-by-Step: Dichotomous Data Meta-Analysis in RevMan
Step 1: Add the Included Studies
As before, use Studies and References to add each of the eight trials (Ibrahim 2018 through Patel 2020).
Step 2: Create the Comparison
Add a new comparison named “Post-operative Pneumonia” and select Dichotomous as the outcome type.
Step 3: Select the Model and Effect Measure
Choose the Random Effects model with Risk Ratio as the effect measure, appropriate for comparing event rates between two groups.
Step 4: Enter the Study Data
For each study, enter the number of pneumonia events and the total sample size for both the early mobilization group and the standard care group.
Step 5: Generate the Forest Plot
Select Add Figure, choose Forest Plot, select the Post-operative Pneumonia outcome, and click Finish.
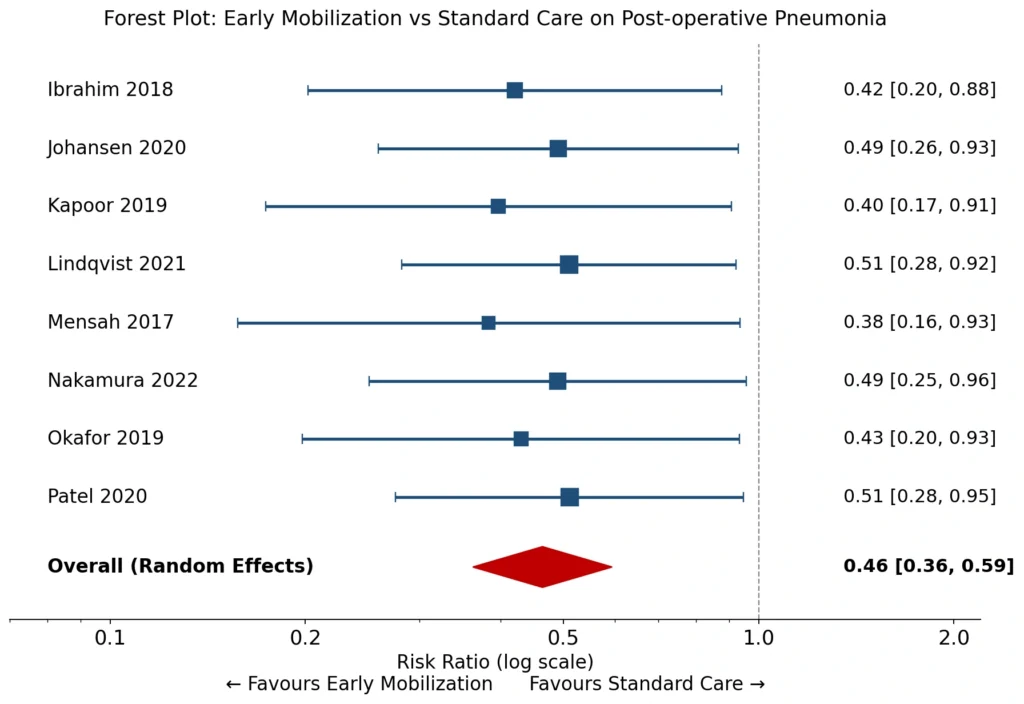
Figure 4: Forest plot for the dichotomous outcome, early mobilization vs. standard care on pneumonia risk.
Every study shows a Risk Ratio below 1.0, consistently favouring early mobilization, and most individual confidence intervals exclude 1.0. The pooled random-effects Risk Ratio is 0.46 (95% CI: 0.36 to 0.59), meaning early mobilization is associated with roughly a 54% relative reduction in post-operative pneumonia risk. This effect is highly significant (Z = -6.09, p < 0.00001), and heterogeneity is minimal (I² = 0%), indicating the trials agree closely on the size of the benefit.
Step 6: Generate the Funnel Plot
Repeat the Add Figure process and select Funnel Plot for the pneumonia outcome.
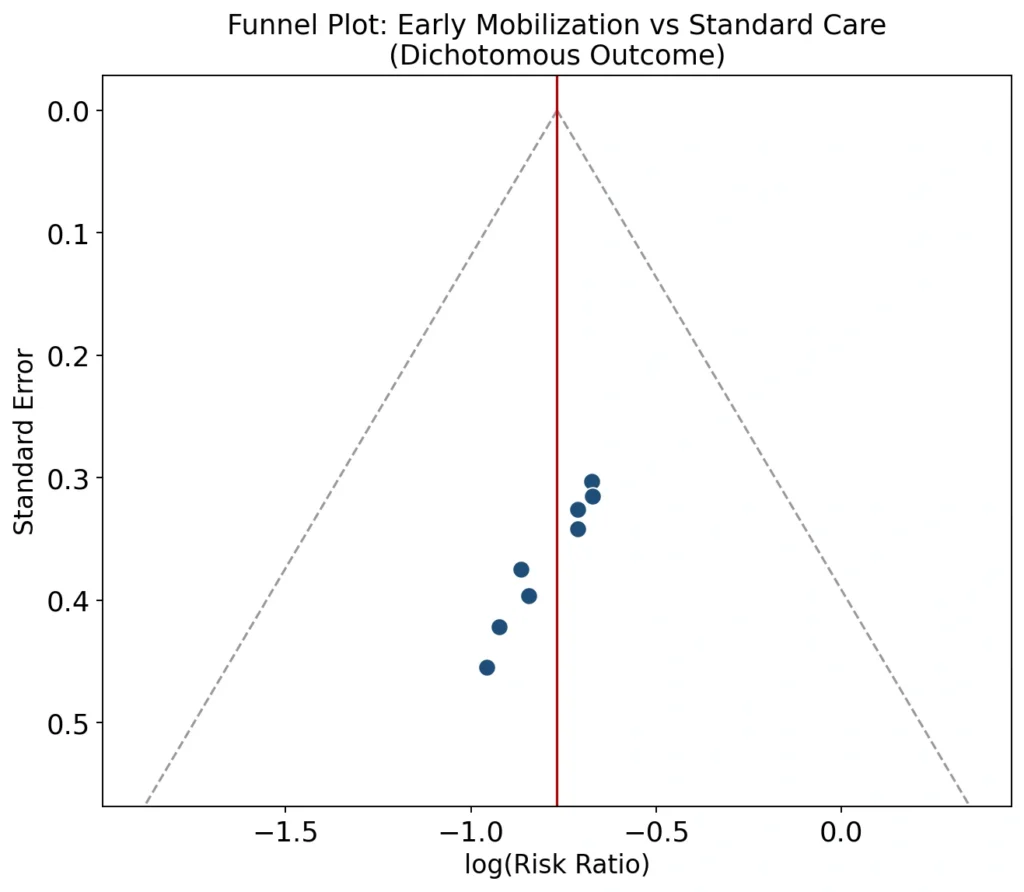
Figure 5: Funnel plot for the dichotomous outcome, checking for asymmetry that might suggest publication bias.
The studies scatter symmetrically around the pooled log Risk Ratio, with no visible skew toward missing small studies on either side. As with any funnel plot based on a modest number of trials, this remains a visual check rather than a definitive test.
How Simbi Labs Supports Meta-Analysis in RevMan
Running a defensible meta-analysis in RevMan is as much a methodological discipline as it is a software skill. Simbi Labs works with academic and clinical research teams to design the review protocol, extract and validate study-level data, choose the appropriate effect measure and model, and build the final RevMan file, forest plots, funnel plots and all, ready for submission or publication.
Frequently Asked Questions
1.What is meta-analysis in RevMan used for?
It is used to statistically combine the results of multiple independent studies into a single pooled estimate, most commonly as part of a Cochrane-style or other formal systematic review of an intervention’s effect.
2. Is RevMan free to use?
Yes. RevMan is developed by Cochrane and is available free of charge, which is one of the main reasons it remains the standard choice for systematic review teams worldwide.
3. How do I decide between a fixed-effect and a random-effects model?
Use a random-effects model whenever the included studies differ meaningfully in population, setting or intervention details, which is the case in most real-world reviews. A fixed-effect model is only appropriate when the studies are close to clinically identical.
4. What does an I² value of 0% mean in a RevMan meta-analysis?
It means none of the observed variation between study estimates is attributable to genuine differences between studies; the studies are statistically consistent with estimating the same true effect, and any spread in the individual results is explained by chance alone.
5. Can RevMan be used for both continuous and dichotomous outcomes?
Yes. RevMan for meta-analysis supports Mean Difference and Standardized Mean Difference for continuous outcomes, and Risk Ratio, Odds Ratio and Risk Difference for dichotomous outcomes, alongside subgroup and sensitivity analysis for both data types.
6. How many studies are needed before a funnel plot is meaningful?
As a practical rule, funnel plot asymmetry tests are considered underpowered with fewer than around ten studies; with smaller numbers, the plot can still be inspected visually but should not be treated as a definitive test for publication bias.