
Power Analysis for Partial Correlation in SPSS
Power Analysis for Partial Correlation in SPSS
Introduction
Statistical power analysis is an important part of research planning. It ensures your study has a sufficient sample size to detect meaningful effects, or lets you estimate the probability of detecting those effects given your existing data. Performing power analysis before collecting data helps avoid wasted resources and inconclusive results.
Performing a power analysis for partial correlation in SPSS is crucial for validating your research outcomes.
Understanding power analysis for partial correlation in SPSS can greatly aid in accurately interpreting your data.
While Pearson and Spearman correlations measure the strength of association between two variables, partial correlation goes one step further — it measures the association between two variables while controlling for the effect of one or more additional variables. This is especially useful in situations where confounding factors might influence the relationship you’re studying.
Read More : Power Analysis for Pearson Correlation in SPSS
For example:
1. Exam score vs. study hours, controlling for prior GPA
2. Blood pressure vs. exercise frequency, controlling for age
To effectively utilise power analysis for partial correlation in SPSS, researchers must ensure their sample sizes meet the necessary criteria.
3. Sales vs. advertising budget, controlling for market size
The significance of power analysis for partial correlation in SPSS cannot be understated, as it informs the robustness of your conclusions.
In such cases, power analysis for partial correlation ensures your study design is sensitive enough to detect meaningful associations after accounting for control variables.
By implementing power analysis for partial correlation in SPSS, researchers can better manage the expectations of their findings.
What is Partial Correlation – Power Analysis in SPSS?
Purpose of the Test
Conducting a power analysis for partial correlation in SPSS will clarify the dynamics between your variables.
A thorough power analysis for partial correlation in SPSS is essential for obtaining credible results.
Partial correlation tests whether two variables are related, after statistically removing the influence of one or more control variables. The power analysis for this test helps determine if your sample size is large enough to detect a true partial correlation of a given magnitude.
Example:
What is the Goal of the Analysis?
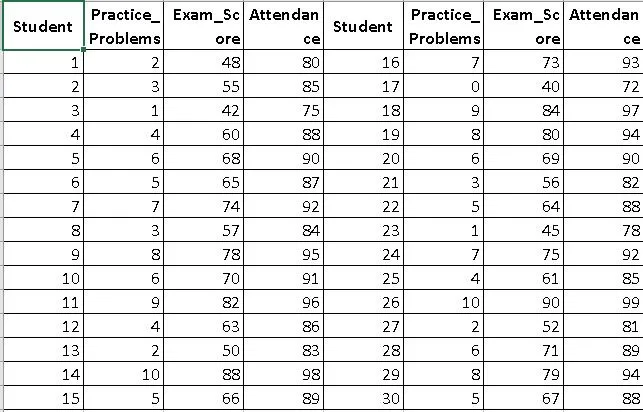
A researcher wants to examine the relationship between students’ exam scores and practice problem completion, while controlling for attendance rate.
Power Analysis Goal:
Understanding the implications of power analysis for partial correlation in SPSS leads to more informed decision-making in research.
Mastering power analysis for partial correlation in SPSS is fundamental for aspiring researchers.
Assess whether the current sample size is large enough to detect a partial correlation of interest (e.g., 0.50)
In summary, power analysis for partial correlation in SPSS should be a key consideration for all statistical analyses.
Hypothetical Dataset:
The insights gained from power analysis for partial correlation in SPSS can enhance the quality of your research findings.
Hypothesis:
1. Null Hypothesis (H₀): ρₚ = 0 (no partial correlation after controlling for attendance)
2. Alternative Hypothesis (H₁): ρₚ ≠ 0 (partial correlation exists)
3. Significance Level: α = 0.05
What are steps in SPSS?
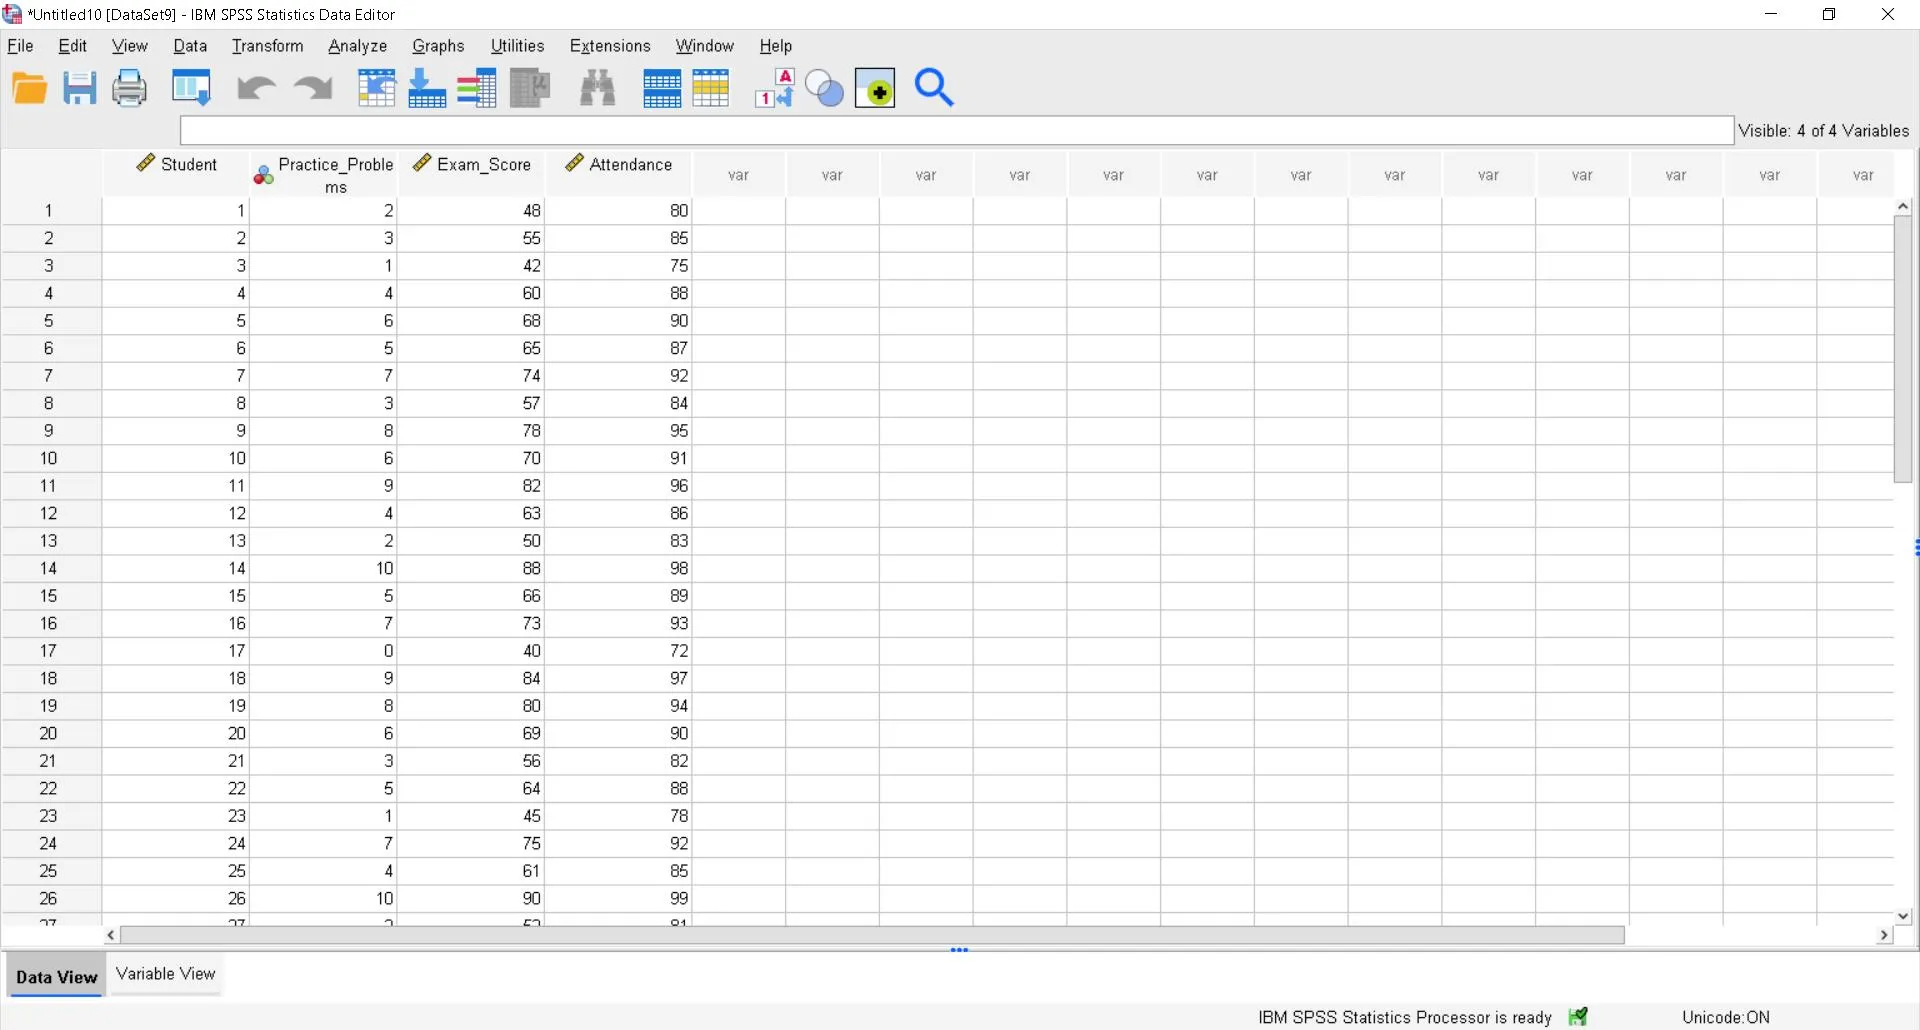
Step 1 – Open the Power Analysis Window
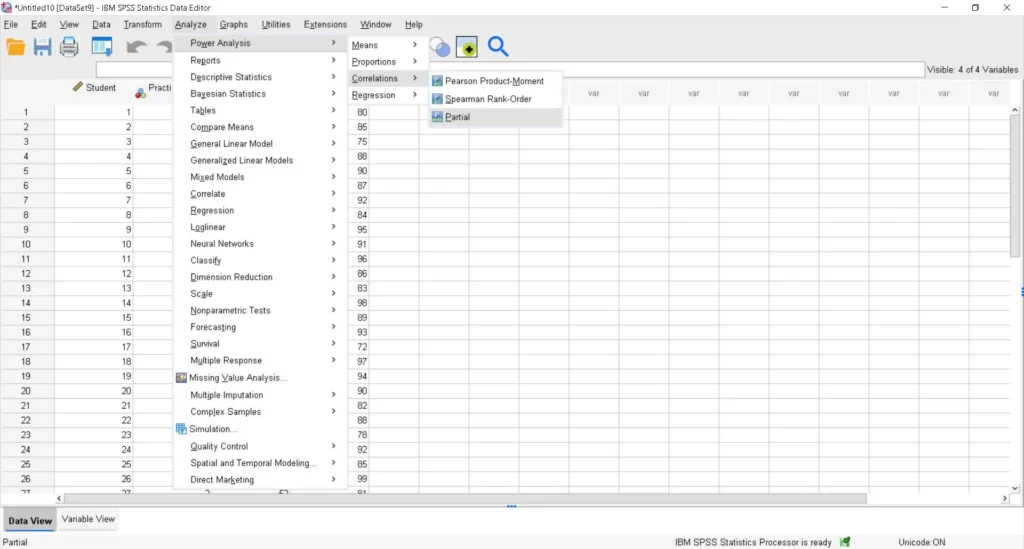
Go to:
Analyze > Power Analysis > Correlation > Partial
By incorporating power analysis for partial correlation in SPSS, you can significantly improve the reliability of your results.
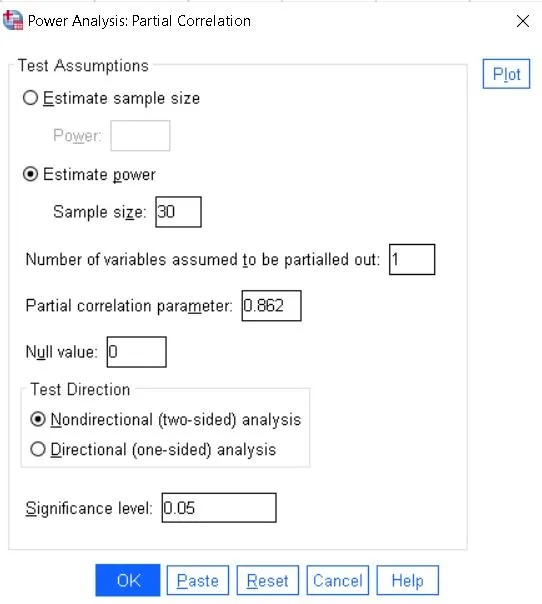
Step 2 – Enter Values for Achieved Power
If estimating the power for existing data:
i. Select: Estimate power
ii. Sample size in pairs: 30
iii. Partial correlation parameter: (Enter 0.862 → this is the partial correlation between Practice_Problems and Exam_Score after controlling for Attendance.)
iv. Number of control variables: 1(in your case, this is Attendance, the control variable.)
v. Null value: 0(this means the null hypothesis assumes no partial correlation.)
vi. Test Direction: Nondirectional (two-sided)
Utilising power analysis for partial correlation in SPSS empowers researchers with the necessary tools to validate their statistical assumptions.
The value of a robust power analysis for partial correlation in SPSS lies in its ability to uncover hidden relationships within data.
vii. Significance level: 0.05
To truly grasp the importance of power analysis for partial correlation in SPSS, one must engage deeply with the statistical concepts at play.
Read More : How to Perform Power Analysis for Means in SPSS: Step-by-Step Guide with Examples
Step 3 – Run the Analysis
Click OK to generate the output.
How to write interpretation for a Partial Correlation Power Analysis in SPSS?
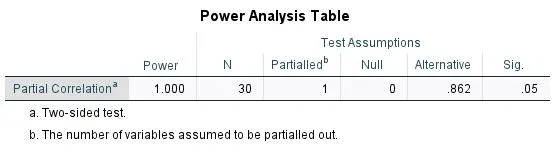
The achieved statistical power for the partial correlation test, controlling for one variable, is 1.000 (100%). This means that with a sample size of 30 and a true partial correlation of 0.862, there is effectively a 100% chance of correctly rejecting the null hypothesis at the 5% significance level (two-sided). This far exceeds the commonly recommended 80% threshold, indicating the study is more than adequately powered to detect the specified effect size.
For an in-depth understanding, please refer to our book, “Academic Research Fundamentals: Research Writing and Data Analysis”. It is available as an eBook here, or you may purchase the hardcopy here .
For an in-depth understanding, please refer to our book, “Academic Research Fundamentals: Research Writing and Data Analysis”. It is available as an eBook here, or you may purchase the hardcopy here .