
Why R Programming Is the Top Choice for Data Analysis in Business and Research
Organisations and researchers today rely on powerful tools to extract meaningful insight from data, and one language keeps coming up in that conversation across both worlds: R. Built specifically for statistics rather than adapted for it, R has become a default choice wherever the work involves modelling relationships, testing hypotheses or visualising results clearly enough to publish.
R programming data analysis covers everything from basic descriptive statistics to advanced predictive modelling, all inside one open-source environment with a large ecosystem of purpose-built packages.
What Is R in Data Analytics
R is a programming language and computing environment purpose-built for statistical analysis and graphics, first developed in the 1990s and now maintained by a large open-source community. Unlike general-purpose languages adapted for data work, R was designed from the outset around vectors, data frames and statistical functions, which is why so much of statistical analysis using R reads closer to mathematical notation than conventional code.
- Open-source and free to use, with no licensing cost limiting adoption in academic or early-stage business settings.
- An extensive package ecosystem covering everything from data wrangling to machine learning and Bayesian statistics.
- Strong native support for statistical modelling, from a simple t-test to multilevel and time-series models.
- Advanced, highly customisable data visualisation through packages such as ggplot2.
- Straightforward integration with Python, SQL and big-data tools such as Spark, so R rarely works in isolation.
A Worked Example: Advertising Spend and Sales in R
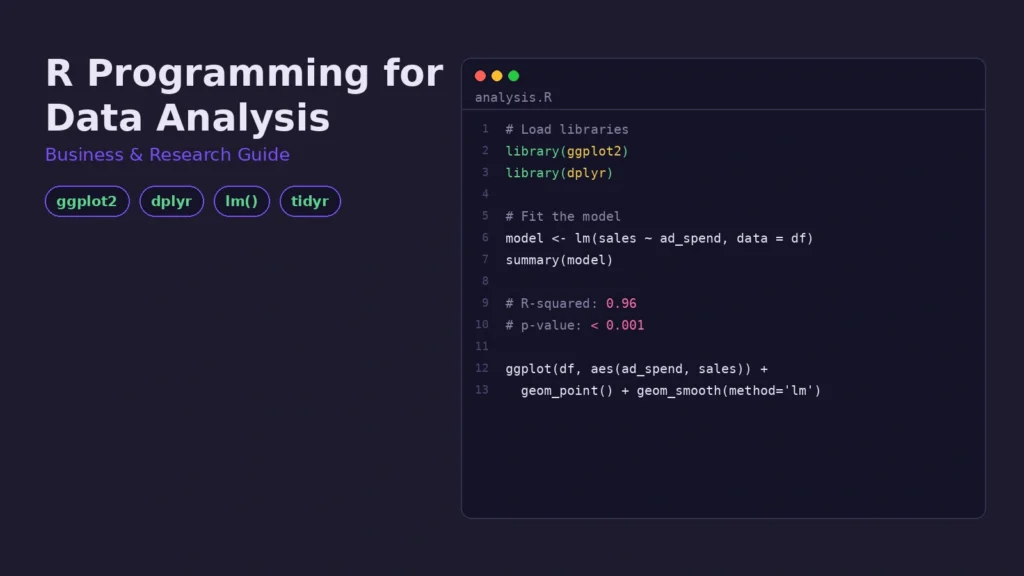
To make data analysis with R programming concrete rather than abstract, consider a small business dataset: monthly advertising spend and the resulting sales figure across twelve months. The R script below loads the data, fits a linear model, and visualises the relationship, exactly the sequence a working analyst would run.
| Statistic | Value | Interpretation |
| Intercept | 82.90 | Predicted sales at zero ad spend (₹ thousands) |
| Slope (ad_spend) | 3.45 | Each extra ₹1,000 in spend adds ~₹3,450 in sales |
| R-squared | 0.96 | Ad spend explains about 96% of the variation in sales |
| p-value | < 0.001 | The relationship is very unlikely to be due to chance |
Visualising the Relationship
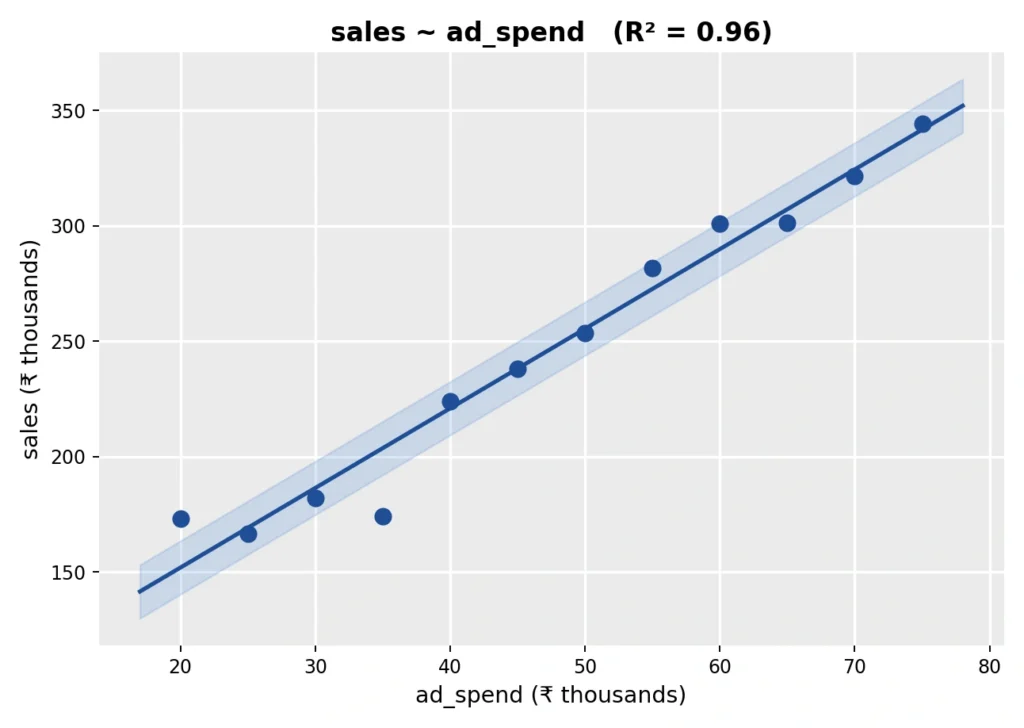
Figure 1. ggplot2-style visualisation of the fitted model, generated from lm(sales ~ ad_spend).
The fitted line in R’s ggplot2 output makes the relationship immediately legible: sales rise consistently as ad spend increases, and the shaded band around the line shows the range within which the true relationship is likely to fall. This single script, a handful of lines using lm() and ggplot(), is representative of how much of real analytics with R programming actually looks in practice: short, readable, and immediately visual.
Why R Remains Popular for Statistical Work
1. Advanced Statistical Capabilities
R is built specifically for statistical computing, which makes statistical analysis using R more robust and precise for hypothesis testing, regression and multivariate methods than tools adapted from general-purpose spreadsheets.
2. A Rich Ecosystem of Packages
Packages such as ggplot2, dplyr, tidyr and caret extend data analytics with R programming into visualisation, data wrangling, cleaning and machine learning without switching environments.
3. High-Quality Visualisation
R produces detailed, fully customisable graphics suited to journal figures and executive dashboards alike, rather than generic default charts.
4. The Open-Source Advantage
Being free and open-source keeps R accessible to students, startups and large enterprises equally, with no licence cost standing between a researcher and the analysis.
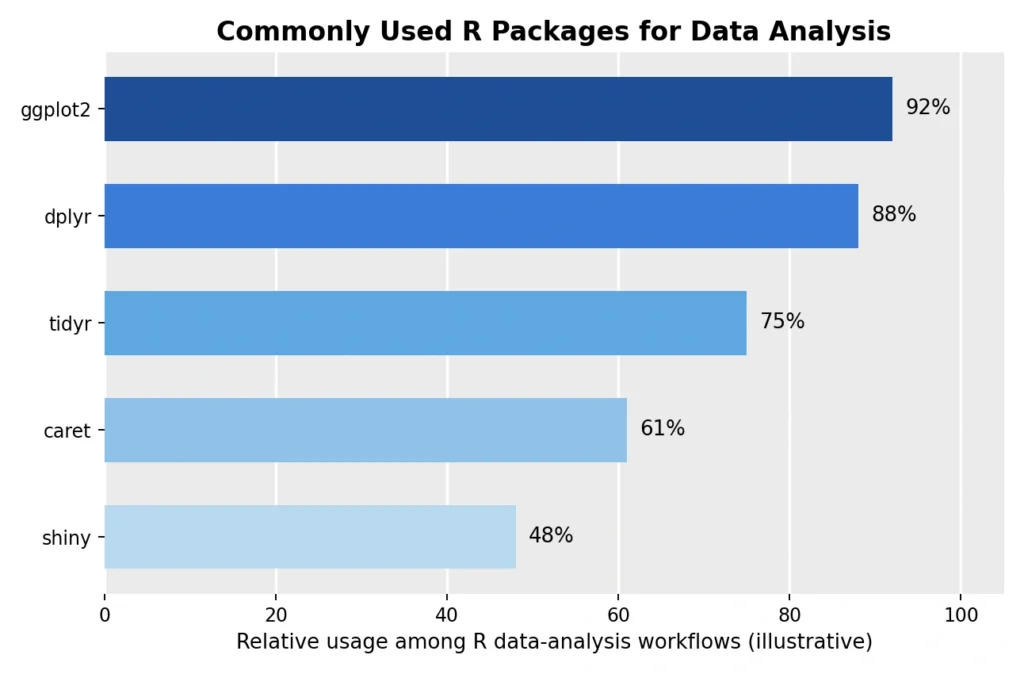
Figure 2. Packages that most commonly appear together in R data-analysis workflows.
Business Role of R Programming
R programming plays an important role in business data analysis by helping organisations understand customer behaviour, analyse financial trends, measure marketing performance, and improve supply chain planning. It can analyse purchase data to identify valuable customers, support price and risk forecasting, evaluate advertising results, and predict product demand. These insights help businesses make better decisions, improve efficiency, and manage resources effectively.
R Programming in Data Analytics
| Category | Tool / Benefit | Description |
| R Data Analysis Tools | ggplot2 | Builds layered, publication-quality visualisations using a consistent grammar of graphics. |
| R Data Analysis Tools | dplyr | Filters, groups, and transforms data frames using readable, chainable syntax. |
| R Data Analysis Tools | tidyr | Reshapes and cleans data into the tidy format expected by most R functions. |
| R Data Analysis Tools | caret | Builds and validates predictive and machine-learning models through a consistent interface. |
| Major Benefits | Scalability | Handles large datasets efficiently, with options such as data.table and Spark integration for very large volumes. |
| Major Benefits | Flexibility | Allows custom scripts to be developed for analytical requirements that menu-driven tools may not accommodate. |
| Major Benefits | Community Support | Supported by a large global user community that develops packages and provides technical resources. |
| Major Benefits | Integration | Connects with Python, SQL, and big-data platforms, allowing R to fit into broader analytical pipelines. |
| Choosing an Analytics Partner | Expertise | Look for proven expertise in statistical modelling and experience applying R-based analytics across different industries. |
| Choosing an Analytics Partner | Customisation | Consider providers offering customised analytical solutions rather than templated approaches. |
| Choosing an Analytics Partner | Data Security | Evaluate clear data-security and confidentiality practices when selecting an analytics provider. |
From Script to Decision
R programming data analysis earns its place not from novelty but from how directly it connects a research question to a defensible answer: a model is fit, its assumptions and fit statistics are checked, and the result is visualised in the same environment, with the full script available for anyone to rerun. That combination of statistical depth, visualisation quality and reproducibility is what keeps R central to both academic research and business analytics, even as newer tools continue to appear around it.
Looking to use data to power your business? Contact professionals experienced in R programming for data analysis and get your data into actionable insights today!
Book a free consultation for appointment
Email us at : grow@simbi.in
FAQs
1. What is R in data analytics?
R is an open-source programming language and environment built specifically for statistical computing and graphics, widely used for data manipulation, statistical modelling and visualisation.
2. Why choose R programming data analysis over spreadsheet tools?
R offers far greater statistical depth, reproducible scripts instead of manual point-and-click steps, and publication-quality visualisation through packages such as ggplot2, all at no licensing cost.
3. What packages are most useful for data analysis with R programming?
ggplot2 for visualisation, dplyr for data manipulation, tidyr for cleaning and reshaping data, and caret for predictive modelling cover most of what a typical analysis workflow needs.
4. How is data analytics with R programming used in business?
Businesses use it for customer analytics, financial forecasting, marketing campaign analysis and supply chain optimisation, generally by fitting statistical or predictive models to operational data.
5. Is R considered reliable data analytics software for research?
Yes; its statistical foundations, transparent scripting and wide academic adoption make it a standard choice for hypothesis testing, regression analysis and reproducible research reporting.