
Predicting Profits: Statistical Approach to Aseptic Packaging Investment

Financial Feasibility
Financial feasibility is the process of analyzing whether an investment in aseptic packaging will be financially sustainable, profitable, and worth the initial and ongoing costs. It ensures that the business has the resources to set up the system, manage operating costs, and generate enough returns to justify the investment.
Read Also : Top Statistical Methods For Analyzing Data And Making Informed Decisions
Key Components of Financial Feasibility
1. Revenue
Revenue is the total money a business earns by selling its products. In aseptic packaging, this usually comes from items like milk, juices, and ready-to-eat meals. Revenue depends on how many units are sold (demand and production volume), the selling price per unit, and how efficiently products are distributed to the market. A higher demand or better distribution network directly increases revenue.
2. Depreciation
Depreciation is the gradual decrease in the value of assets such as packaging machines, sterilizers, and factory buildings. Even if no cash goes out, depreciation is recorded in accounts to reflect wear and tear. It also helps reduce taxable income since it is treated as an expense. Including depreciation gives a more realistic picture of long-term costs.
3. Loan Repayment and Interest
Many companies take loans to buy expensive aseptic packaging equipment. These loans must be repaid over time along with interest. Loan repayment becomes a fixed financial obligation, and interest increases overall costs. Ignoring these can lead to overestimating profit, so they must be carefully planned in cash flow projections.
4. Operating Cost
Operating cost covers all the day-to-day expenses needed to keep the packaging line running. This includes electricity and water, labor wages, chemicals for sterilization, maintenance services, and packaging materials. Since these are recurring, they have a big impact on profitability and must be monitored regularly.
5. Total Expenditure
Total expenditure is the sum of all costs incurred by the business. It includes capital investment, depreciation, operating costs, and financial obligations such as loan repayments. It is often expressed as:
Formula: Total Expenditure = Fixed Cost + Variable Cost + Financial Obligations
6. Profit and Profit Margin
Profit is what remains after deducting all costs from revenue. If revenue is higher than expenditure, the business earns a surplus (profit). The profit margin expresses this surplus as a percentage of revenue, showing how efficiently the business converts sales into profit.
Formula:
Profit = Revenue – Total Expenditure
Profit Margin = (Profit / Revenue) × 100
A higher margin means the business is more financially efficient.
7. Internal Rate of Return (IRR)
IRR is a financial metric used to evaluate whether an investment is worthwhile. It represents the annual return percentage expected over the life of the project. If the IRR is higher than the return from other investment options (like bank deposits or bonds), the project is considered attractive. In aseptic packaging, IRR helps investors and managers decide if the project is profitable enough compared to alternatives.
Example
Forecasting Sales & Calculating Break-even Point for Aseptic Juice Packaging Plant
Objective
A food company wants to set up an aseptic juice packaging unit. They want to assess whether the project is financially feasible over the next 5 years.
Step 1: Use of Time Series Forecasting for Revenue Projection
The company has 3 years of sales data from a similar setup in another region:
| Year | Units Sold (in lakhs) |
| 2022 | 20 |
| 2023 | 24 |
| 2024 | 27 |
Using linear regression (Time Series Analysis), we project:
2025 Expected Sales = 30 lakh units
Selling Price per Unit = ₹15
Projected Revenue (2025) = 30 lakh × ₹15 = ₹4.5 crore
Step 2: Cost Structure
| Cost Component | Amount (₹) |
| Fixed Cost (Plant, Rent) | 1.2 crore |
| Variable Cost (per unit) | ₹7 |
| Total Variable Cost | 30 lakh × ₹7 = 2.1 crore |
| Total Cost | 1.2 + 2.1 = ₹3.3 crore |
Step 3: Profit Calculation
| Item | Value (₹) |
| Revenue | ₹4.5 crore |
| Total Cost | ₹3.3 crore |
| Profit | ₹1.2 crore |
| Profit Margin | 26.7% |
Step 4: Break-even Analysis
Break-even units = Fixed Cost / (Selling Price – Variable Cost)
= ₹1.2 crore / (₹15 – ₹7)
= 15 lakh units
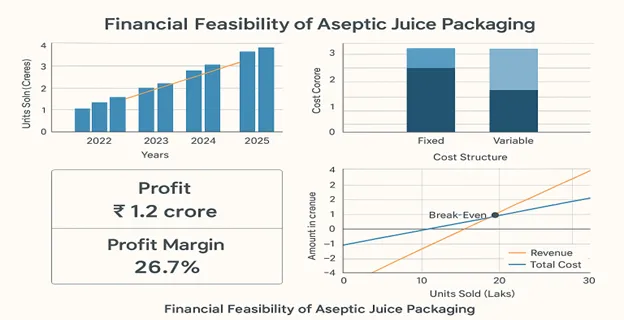
These graphs summarizes the financial feasibility of an aseptic juice packaging unit, highlighting revenue growth, cost structure, break-even point, and profit margin. It visually supports investment decisions through clear, data-backed financial insights.
Application of Statistical Techniques in Financial Feasibility (Aseptic Packaging)
| Area | Statistical Technique | Application |
| Revenue Forecasting | Time Series Analysis | Predict future sales based on historical data and seasonality. |
| Cost Analysis | Descriptive Statistics | Summarize average, median, and range of operating costs, utilities, and inputs. |
| Profit Margin Estimation | Regression Analysis | Analyze how cost components affect profit margins. |
| Loan & Interest Analysis | Sensitivity Analysis | Test how changes in interest rates or loan terms impact overall feasibility. |
| Break-even & ROI Evaluation | Break-even Analysis | Determine minimum production/sales level needed to avoid losses. |
| Risk Management | Monte Carlo Simulation | Evaluate financial risks using probability-based scenarios. |
| IRR & Investment Evaluation | Scenario Analysis | Assess financial outcomes under best-case, worst-case, and expected scenarios. |
| Capital Budgeting Decisions | Net Present Value (NPV) Calculations | Forecast project value over time considering cash flows and discount rates. |
| Depreciation Monitoring | Trend Analysis | Monitor asset value decline and replacement schedules. |
| Operational Efficiency | Control Charts (SPC) | Monitor production process variations affecting cost and profitability. |
Common Financial Evaluation Methods
| Method | Why It’s Used |
| Cost-Benefit Analysis | Compares total project benefits with total expected costs |
| Break-Even Analysis | Identifies when the investment will start generating profits |
| ROI (Return on Investment) | Calculates the percentage of profit relative to investment cost |
| Payback Period | Measures how long it takes to recover the initial investment |
| Sensitivity Analysis | Tests how changes in cost or sales impact financial outcomes |
Conclusion
Financial feasibility analysis helps ensure that an aseptic packaging project will generate enough income to cover expenses, repay loans, and earn a reasonable profit. By evaluating revenue potential, managing costs, and calculating financial indicators like IRR and profit margin, businesses can make confident, data-backed investment decisions. A well-planned aseptic setup not only supports food safety but also promises long-term financial returns.
For an in-depth understanding, please refer to our book, “Academic Research Fundamentals: Research Writing and Data Analysis”. It is available as an eBook here, or you may purchase the hardcopy here .