
Statistical Analysis Medical Data: Experimental Medical Research

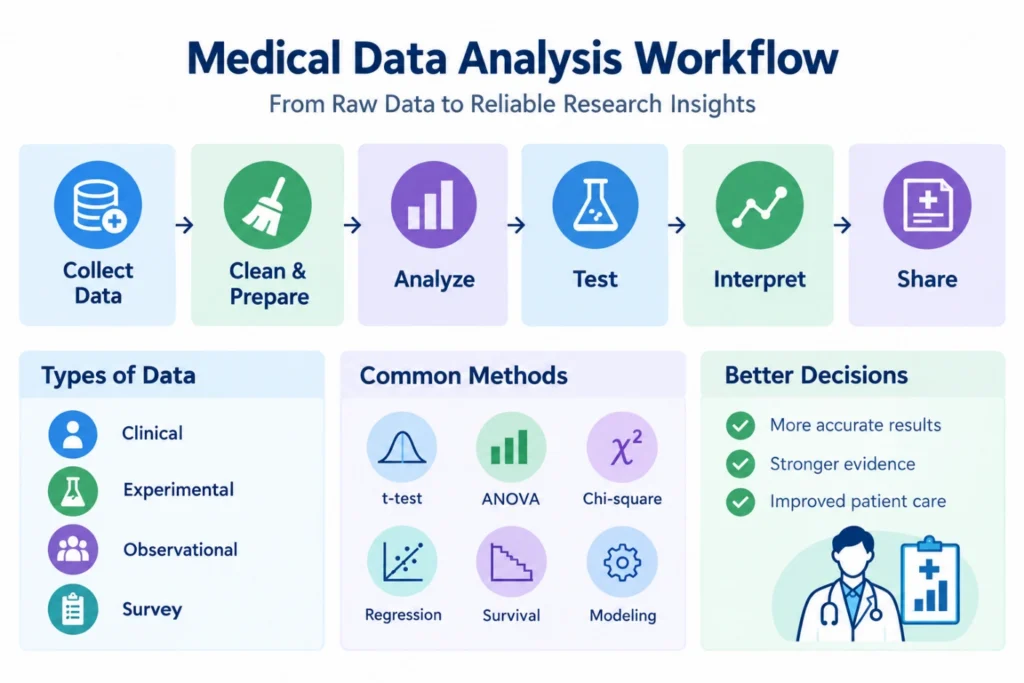
Medical research generates data to evaluate treatments, understand disease patterns, assess interventions, and improve patient outcomes. Statistical analysis medical data helps convert these observations into meaningful evidence for research interpretation.
In experimental medical research, statistics helps determine whether an intervention produces a measurable effect. Comparisons between treatments, before-and-after outcomes, and multiple treatment groups can be evaluated using appropriate statistical analysis of medical data.
Statistical Analysis of Medical Data in Experimental Research
Experimental medical research begins with a defined research question, hypothesis, study population, intervention, comparison group, and measurable outcomes. For example, a clinical study may compare a new treatment with an existing treatment by measuring patients’ blood pressure before and after the intervention.
The statistical method depends on the research design, outcome type, sample size, measurement scale, and data distribution. Medical data statistical analysis therefore involves more than selecting a statistical test; it connects the research objective, data characteristics, statistical assumptions, analysis, and interpretation.

From Medical Data Collection to Statistical Interpretation
A reliable analysis begins before the statistical test is performed. Medical datasets should first be checked for missing observations, duplicate records, inconsistent coding, impossible values, and potential outliers.
Descriptive statistics provide an initial picture of the study population and variables. Continuous variables such as age, blood pressure, cholesterol, or glucose levels may be summarised using means and standard deviations when appropriate, while medians and interquartile ranges may be preferable for skewed data. Categorical variables such as treatment group, disease status, or adverse-event categories are generally summarised using frequencies and percentages.
Researchers should also examine the distribution of important variables and assess assumptions relevant to the planned analysis. This preliminary stage helps prevent inappropriate statistical testing and makes the subsequent interpretation more reliable.
Statistical Methods Used in Experimental Medical Research
Statistical methods should be selected according to the research objective, study design, and data structure. For two independent groups, an independent samples t-test can compare continuous outcomes, while a paired t-test evaluates changes measured in the same participants before and after an intervention.
For three or more groups, ANOVA can assess differences between group means. Chi-square and Fisher’s exact tests are commonly used for categorical outcomes. Regression analysis helps examine predictors and relationships, with linear regression suited to continuous outcomes and logistic regression to binary outcomes.
| Research Objective | Type of Medical Data | Suitable Statistical Method | Example Application |
| Compare two independent groups | Continuous | Independent t-test | Comparing blood pressure between two treatment groups |
| Compare before-and-after measurements | Continuous, paired | Paired t-test | Evaluating HbA1c before and after treatment |
| Compare three or more groups | Continuous | ANOVA | Comparing outcomes across three treatment groups |
| Examine association between categorical variables | Categorical | Chi-square test | Treatment response by gender |
| Measure relationship between variables | Continuous | Correlation analysis | Relationship between BMI and blood pressure |
| Predict a continuous outcome | Continuous | Linear regression | Predicting blood pressure from age and BMI |
| Predict a binary outcome | Binary | Logistic regression | Predicting treatment response |
| Analyze time until an event | Time-to-event | Kaplan–Meier / Cox regression | Comparing survival or disease recurrence |
| Analyze repeated measurements | Longitudinal | Repeated-measures / mixed-effects models | Monitoring patient outcomes across multiple visits |
Hypothesis Testing and Treatment Comparisons
Hypothesis testing evaluates whether observed treatment differences are statistically meaningful. Researchers compare a null hypothesis of no difference with an alternative hypothesis.
The p-value indicates the strength of evidence against the null hypothesis. Researchers should also consider effect size, confidence intervals, and clinical relevance because statistical significance does not always indicate meaningful patient benefits.
Effect Size and Clinical Significance
Statistical analysis medical data should consider more than statistical significance. Effect size shows the magnitude of a treatment difference, while confidence intervals indicate the precision of the estimate. These measures provide more meaningful interpretation than a p-value alone.
A statistically significant result may have limited clinical value if the actual treatment effect is too small to influence patient care. Researchers should therefore consider effect size, confidence intervals, and clinical relevance when interpreting medical research findings.
Managing Confounding, Missing Data, and Outliers
Medical datasets rarely have perfect observations. Participants may withdraw from a study, measurements may be missing, or some observations may be unusually high or low.
Missing data should be investigated rather than automatically removed. The appropriate approach depends on why observations are missing, how much data are missing, and the study design.
Confounding is another important consideration. A relationship between treatment and outcome may partly reflect differences in variables such as age, disease severity, lifestyle, or baseline health status. Regression models and other analytical approaches can help account for relevant confounding factors.
Outliers should also be investigated carefully. An extreme value may represent a genuine clinical observation, a measurement error, or a data-entry problem. Removing observations without a clear justification can distort the findings.
Experimental Medical Research Example
Suppose researchers conduct a six-month study to evaluate a new intervention for patients with type 2 diabetes. Participants are assigned to an intervention group or a comparison group. HbA1c is measured at baseline and after six months.
The analysis may begin with descriptive statistics to compare participant characteristics. Baseline measurements can then be examined to understand the groups before treatment. A suitable comparison can evaluate the change in HbA1c, while regression analysis may adjust for relevant baseline characteristics.
The final interpretation should report the estimated treatment effect, confidence interval, statistical significance, and clinical relevance. If adverse events are also recorded, categorical analysis can be used to compare their occurrence between groups.
This example demonstrates how statistical analysis of medical data connects study design, data preparation, statistical testing, and clinical interpretation.
Statistical and Clinical Significance
Statistical significance indicates whether an observed result is unlikely to have occurred by chance. It is commonly assessed using the p-value, where p < 0.05 is often considered statistically significant.
For example, suppose a new drug reduces blood pressure by 10 mmHg, compared with 8 mmHg for standard treatment.
Mean Difference = 10 − 8 = 2 mmHg
If the statistical test gives p = 0.01, the difference is statistically significant.
Clinical significance refers to whether the size of the effect is large enough to make a meaningful difference to patients or clinical practice. Effect size measures the magnitude of the difference.
A commonly used formula is:
Cohen’s d = (X̄₁ − X̄₂) / SDₚ
If the pooled standard deviation (SDₚ) is 10 mmHg:
d = (10 − 8) / 10 = 0.20
Here, d = 0.20 represents a small effect. Thus, the result may be statistically significant but have limited clinical importance.
Statistical Data Analysis in Health Sciences
Statistical Data Analysis in Health Sciences supports epidemiology, public health, nursing, pharmaceutical research, healthcare management, and diagnostic studies. It helps identify disease patterns, evaluate interventions, assess risk factors, and monitor patient outcomes.
The growing use of electronic health records, clinical databases, wearable devices, and real-world evidence is expanding medical data analysis. Researchers increasingly combine traditional statistical methods with longitudinal analysis, predictive modeling, machine learning, and data visualization.
Common Challenges in Medical Data Statistical Analysis
Experimental medical datasets can present several analytical challenges. Small sample sizes may limit statistical power, while large datasets can produce statistically significant findings that have little practical importance. Non-normal data, repeated measurements, missing observations, multiple outcomes, and confounding variables can also complicate analysis.
Researchers should define primary and secondary outcomes clearly, select statistical methods before examining results whenever possible, assess relevant assumptions, and document analytical decisions. Multiple statistical comparisons may also increase the possibility of false-positive findings, making appropriate planning and interpretation essential.
These considerations strengthen the credibility and reproducibility of medical research.
Get Expert Support for Medical Data Analysis
Reliable statistical analysis medical data is essential for producing meaningful results in experimental medical research. Simbi Labs provides support for medical data statistical analysis, including data preparation, hypothesis testing, regression, survival analysis, statistical modeling, visualization, and interpretation.
Whether you are working on clinical, experimental, observational, thesis, or academic research, our experts can help ensure appropriate statistical analysis of medical data aligned with your research objectives and study design.
Ready to turn your medical data into meaningful research insights? Connect with Simbi Labs today for expert statistical analysis support.Email us at : Book a free consultation for appointment
Call Now : +91 99505 66669
Email : grow@simbi.in
Frequently Asked Questions
1. What is statistical analysis medical data?
Statistical analysis medical data involves organizing, analyzing, and interpreting healthcare and clinical data to identify meaningful differences, relationships, trends, and research outcomes.
2. Why is medical data statistical analysis important in experimental research?
Medical data statistical analysis helps researchers evaluate treatment effects, test hypotheses, compare study groups, and determine whether findings are statistically and clinically meaningful.
3. Which statistical methods are used for statistical analysis of medical data?
Statistical analysis of medical data may include descriptive statistics, t-tests, ANOVA, chi-square tests, correlation, regression, survival analysis, and other methods depending on the study design and data type.
4. Which software can be used for statistical analysis medical data?
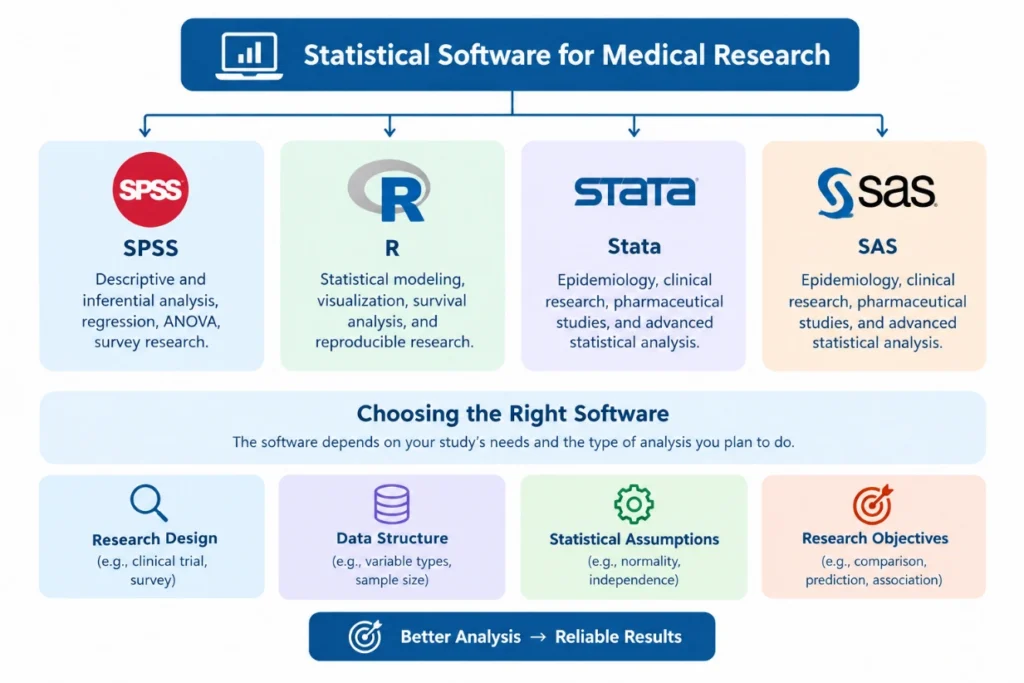
SPSS, R, Stata, and SAS are commonly used for statistical analysis medical data, including clinical research, experimental studies, epidemiological analysis, and healthcare datasets.
5. Can Simbi Labs help with Statistical Data Analysis in Health Sciences?
Yes. Simbi Labs provides support for Statistical Data Analysis in Health Sciences, including data preparation, statistical testing, modeling, visualization, and interpretation for medical and academic research.