
Regression Analysis for Academic Research: A Practical, Step-by-Step Guide
Most research questions eventually reduce to some version of the same problem: does one thing predict, explain or influence another, and by how much?
Regression is the tool that turns that question into a number, a confidence interval and a p-value, which is why it remains the single most used statistical technique in theses, dissertations and published research across every discipline that works with quantitative data.
Regression analysis in research is the process of fitting a model, usually a straight line or its generalisation, that describes how a dependent variable changes as one or more independent variables change.
READ ALSO : Power Analysis for Univariate Linear Regression in SPSS
What Regression Analysis Actually Estimates
Regression analysis in research methodology starts from a simple equation: the dependent variable equals an intercept, plus a coefficient multiplied by each independent variable, plus an error term that captures everything the model does not explain.
Fitting the model means choosing the intercept and coefficients that make the model’s predictions as close as possible to the observed data, which in ordinary least squares means minimising the sum of squared errors.
A Worked Example: Study Hours and Exam Performance
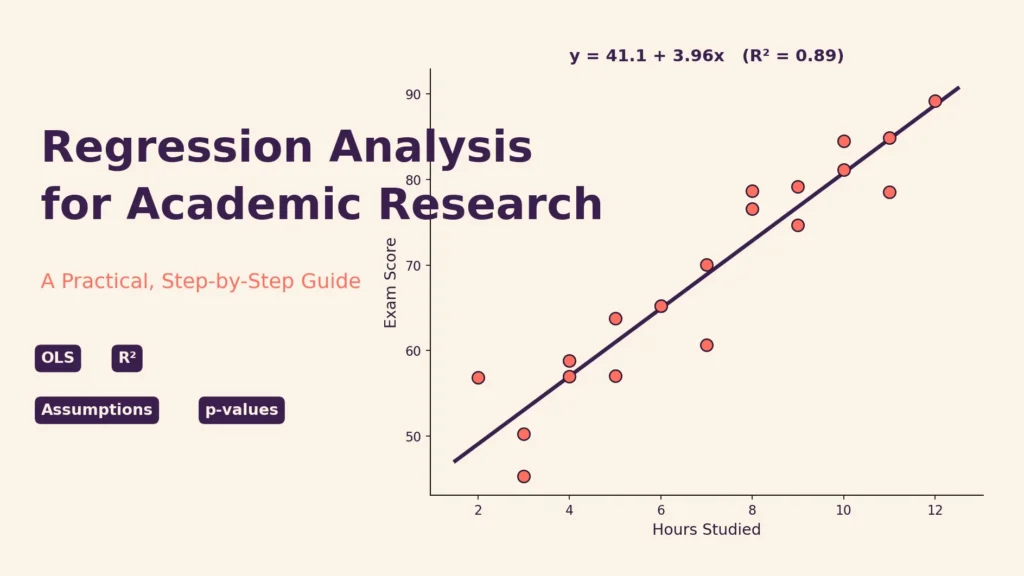
To make the mechanics concrete, consider a simple illustrative dataset of twenty students, recording hours studied and the exam score each student achieved. Fitting an ordinary least squares regression of score on hours studied gives the following result.
| Statistic | Value | Interpretation |
| Intercept | 41.14 | Predicted score at zero hours studied |
| Slope (hours) | 3.96 | Each extra hour raises predicted score by ~4 points |
| R-squared | 0.89 | Hours studied explain about 89% of the variation in scores |
| t-statistic | 11.98 | The slope is far larger than its standard error |
| p-value | < 0.001 | The relationship is very unlikely to be due to chance |
The fitted equation is score = 41.14 + 3.96 x hours studied. With an R-squared of 0.89, hours studied account for the large majority of variation in exam scores in this dataset, and the p-value well below 0.05 indicates the slope is statistically significant. This is exactly the kind of output a regression model in research is expected to produce and report: an equation, a fit statistic, and a significance test, together, not any one of the three alone.
Checking the Assumptions Before Trusting the Output
A significant p-value and a high R-squared mean very little if the model’s underlying assumptions do not hold. Before reporting any regression analysis in research methodology, four assumptions need to be checked against the data, not simply assumed.
- Linearity: the relationship between the independent and dependent variables should be approximately a straight line, checked with a scatterplot before fitting the model.
- Independence of errors: residuals should not be correlated with each other, which matters most for time-series or clustered data.
- Homoscedasticity: the spread of residuals should stay roughly constant across the range of fitted values, rather than fanning out or narrowing.
- Normality of residuals: residuals should be approximately normally distributed, particularly important for small samples where the model relies on this for valid confidence intervals.
Residual Plot
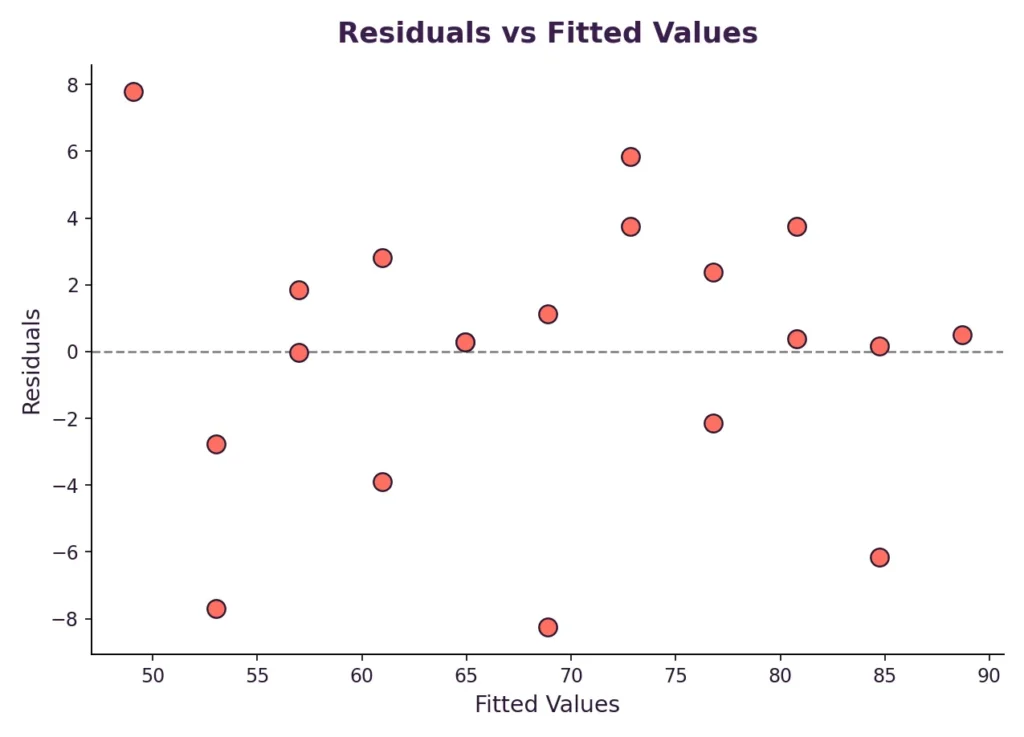
Figure 1. Residuals plotted against fitted values from the worked example, checking linearity and homoscedasticity.
The residuals scatter without an obvious pattern or funnel shape around the zero line, which supports both the linearity and homoscedasticity assumptions for this model. A curved pattern here would suggest a non-linear relationship was fitted as if it were linear, and a widening spread would point to heteroscedasticity that standard errors would need to be corrected for.
Normal Q-Q Plot
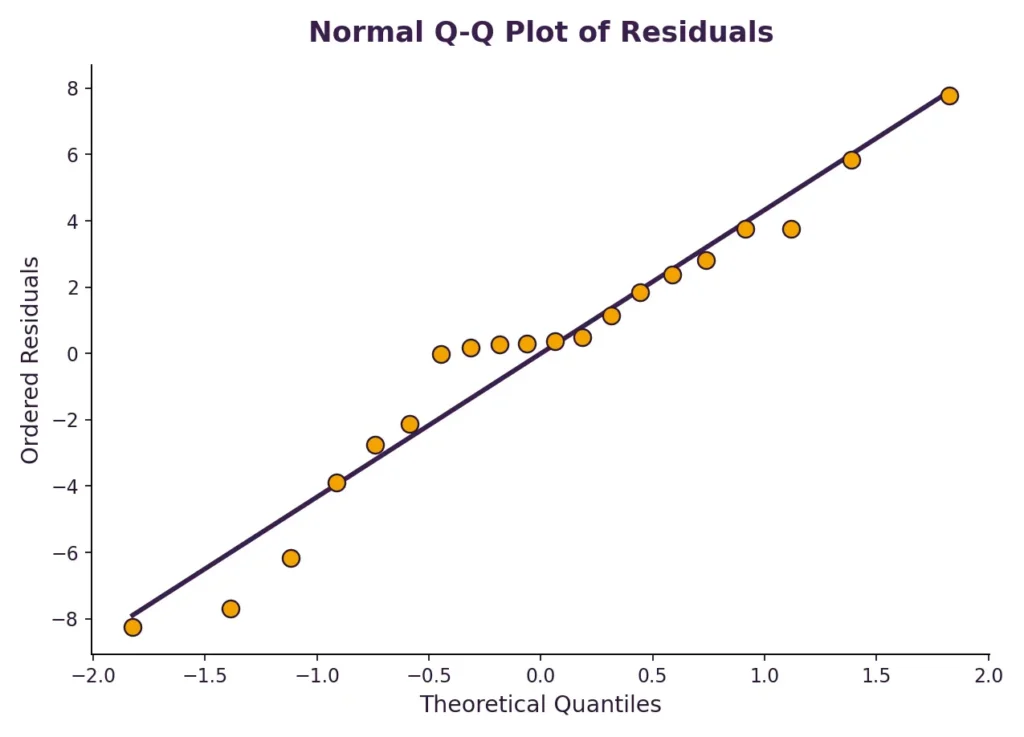
Figure 2. Ordered residuals plotted against theoretical normal quantiles.
Most points fall close to the reference line, with only mild deviation at the extremes, which is consistent with approximately normal residuals for a sample of this size. Systematic curvature away from the line, especially at both tails, would be the signal to investigate transformation of the dependent variable or a different model specification.
READ ALSO : Multiple Linear Regression: Formula, Assumptions, Examples & SPSS Guide
How to Perform Regression Analysis for Academic Research
1. Define Research Objectives
Decide explicitly whether the goal is prediction, explanation of a relationship, or measuring the impact of one variable on another; each framing affects which diagnostics and reporting matter most.
2. Prepare and Clean Data
Check for missing values, outliers and coding errors before fitting anything; a regression run on unclean data produces a precise-looking answer to the wrong question.
3. Choose the Type of Regression
Linear regression suits a continuous outcome, multiple regression extends this to several predictors, and logistic regression applies when the outcome is binary; the choice follows the data, not convenience.
4. Check Assumptions
Verify linearity, normality of residuals, homoscedasticity and the absence of serious multicollinearity between predictors before interpreting any coefficient.
5. Run the Analysis
Use IBM SPSS Statistics, R or Python to fit the model; each produces the same underlying estimates, so the choice is largely about existing familiarity and what a supervisor or journal expects.
6. Interpret Results
Read the R-squared for overall fit, the coefficients for direction and magnitude of each effect, and the p-values for statistical significance, always together rather than any one figure in isolation.
7. Report Findings
Present the fitted equation, key statistics and diagnostic checks in tables and plain-language explanations tied directly back to the original research questions.
Common Mistakes to Avoid
- Ignoring the assumptions of the regression model rather than checking them against diagnostic plots.
- Including variables in the model without a theoretical or empirical basis for their relevance.
- Misreading a large coefficient as automatically meaningful without checking its p-value and standard error.
- Overfitting a model with too many predictors relative to the sample size, inflating R-squared without genuine predictive value.
- Treating a strong correlation as evidence of causation without a study design that supports that claim.
Tools Commonly Used for Regression Analysis
IBM SPSS Statistics remains popular in academic settings for its menu-driven interface and clear default output tables. R and Python offer more flexibility for custom diagnostics, larger datasets and reproducible scripts, which matters increasingly for journals that expect shared analysis code. Microsoft Excel can fit a simple linear regression adequately for small, single-predictor problems, though it becomes unwieldy once diagnostics and multiple predictors are involved.
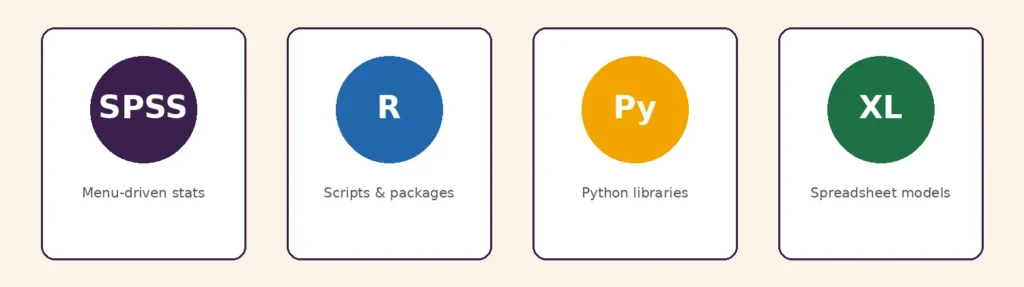
Figure 3. Commonly used tools for running regression analysis: IBM SPSS Statistics, R, Python and Microsoft Excel.
From Coefficients to Defensible Conclusions
A regression model in research is only as credible as the checks behind it. The worked example above shows what that looks like end to end: a fitted equation with an R-squared and p-value, followed by residual and normality diagnostics that confirm the model’s assumptions are reasonably satisfied before any conclusion is drawn from the coefficients. Skipping that second half of the process is the single most common reason regression results in student research get challenged at viva or peer review.
Connect with Simbi Labs to turn your data into reliable, actionable insights.
Book a free consultation for appointment
Email us at : grow@simbi.in
FAQs
1. Why is regression analysis in research so widely used?
It quantifies the relationship between variables in a single interpretable equation, along with a statistical test of whether that relationship could be due to chance, which is exactly what most hypothesis-driven research questions require.
2. What does R-squared tell you about a regression model in research?
It shows the proportion of variation in the dependent variable explained by the independent variables in the model; in the worked example here, an R-squared of 0.89 means hours studied explain about 89% of the variation in exam scores.
3. What assumptions matter most in regression analysis in research methodology?
Linearity, independence of errors, homoscedasticity and normality of residuals are the four checked most consistently, usually through scatterplots, residual plots and a normal Q-Q plot of the residuals.
4. How is regression analysis for academic research typically reported?
As a fitted equation with coefficients, the R-squared, the relevant significance tests such as t-statistics and p-values, and evidence that model assumptions were checked, usually through diagnostic plots included alongside the results.
5. What is the most common mistake in student regression analysis?
Reporting a significant coefficient and R-squared without checking whether the model’s assumptions hold, which can make an apparently strong result difficult to defend under closer examination.