
Real-Time Dashboards: Transforming Decision-Making for Businesses in India
Why Businesses Need Faster Access to Data
It is no longer possible to use only static reports which come hours or days after data is collected. In industries that move quickly, insights that are delayed are likely to result in lost opportunities and delayed reactions to a problem in the operations. That is why real-time dashboards have become an important component of a contemporary business intelligence that could help an organization monitor activities, track performance, and respond to changes in real-time.
In the case of businesses and research organizations in India, the implementation of real-time dashboards will enhance the efficiency and decision-making process by transforming live data into actionable insights.
Understanding How Real-Time Dashboards Work
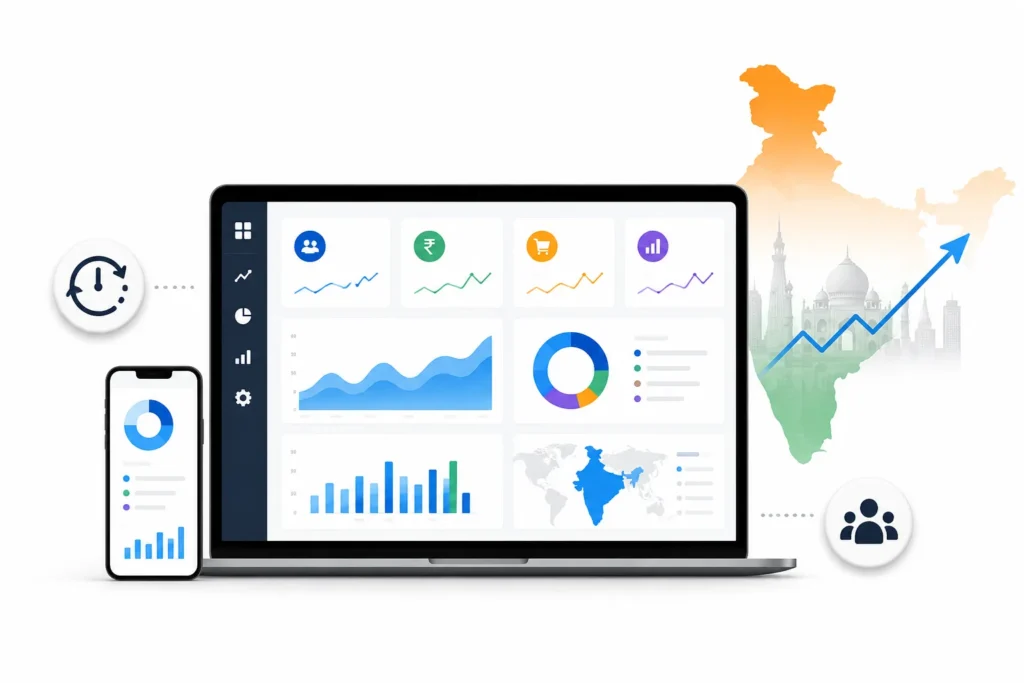
Real-time dashboards are computer-based systems that aim to present live data collected during surveys, business processes or field work in a visual and interactive way. Users can get updated information on a continuous basis through charts, graphs, and KPI trackers, rather than wait until manual reports are made available.
These dashboards integrate data collection, processing and visualization into a single workflow and they enable teams to monitor progress and identify issues without delays. Due to the growing reliance of organizations on live reporting systems, real-time dashboards have become a necessity in ensuring the visibility of operations.
The Process Behind Real-Time Dashboards
Data Collection
Mobile apps, surveys, digital forms or built-in business systems are some of the ways that information is captured.
Data Synchronization
The responses gathered are automatically relayed to centralized cloud-based systems or servers.
Data Processing
The system systematizes, authenticates and formats the incoming information to guarantee uniformity.
Visualization
The processed data is presented by the dashboards on the graphs, maps, tables, and KPI indicators.
Monitoring and Action
The teams keep track of performance on the spot and take decisions based on the most up-to-date data. This workflow enables real-time dashboards to maintain the continuous visibility of operations going on.
Key Features That Make Real-Time Dashboards Effective
The design of a dashboard will be focused on being clear, easy to access, and easy to use rather than merely being able to display a lot of information.
- Live Updates: Data is automatically updated with minimum delay.
- Interactive Visuals: Charts and graphs make complex data easier to understand.
- Custom Filters: The user can filter the data according to the region, category, or time.
- KPI Monitoring: The key performance indicators can be seen at all times.
- Simple Navigation: Interfaces are user-friendly, enhancing user accessibility among teams.
The features enhance the effectiveness of real-time dashboards in industries.
Benefits of Using Real-Time Dashboards
Faster Decision-Making
Organizations can identify trends and respond immediately instead of waiting for periodic reports.
Better Accuracy
Automated systems reduce manual errors commonly associated with spreadsheet-based reporting.
Improved Transparency
Stakeholders can monitor field activities and project performance continuously.
Increased Operational Efficiency
Teams spend less time compiling reports and more time focusing on execution.
Early Issue Detection
Problems can be identified quickly before they affect larger business outcomes.
These advantages explain why businesses increasingly depend on real-time dashboards for daily operations.
Best Practices for Managing Real-Time Dashboards
Organizations ought to adhere to an organized implementation strategy in order to maximize performance.
- Establish clear KPIs that are consistent with business objectives.
- Maintain dashboard layouts simple to read and comprehend.
- Apply similar visualization format to make it clear.
- Confirm the data received on a regular basis to ensure accuracy.
- Educate train teams on how to effectively use dashboard insights.
Implementing these practices will make sure that real-time dashboards are not overwhelming but actionable and useful.
Common Challenges That Reduce Dashboard Efficiency
Even sophisticated dashboards may not help in case of improper management.
- Packing too much redundant metrics on the screens.
- Complex visualizations that are not easily understood.
- Not updating data regularly.
- Bypassing data validation procedures.
- Creation of dashboards without definite business goals.
By avoiding these problems, organizations can achieve the maximum out of real-time dashboards.
Popular Tools Used for Real-Time Dashboards
Several platforms are widely used to build and manage real-time dashboards in India.
- Microsoft Power BI
- Tableau
- Looker Studio
- Microsoft Excel
- SurveyCTO
These tools support live reporting, visualization, and advanced analytics across different business environments.
Industry Applications of Real-Time Dashboards in India
Market Research
Tracking survey responses and consumer trends instantly.
Healthcare
Monitoring patient data and public health field operations.
Retail and FMCG
Analyzing sales performance and customer behavior in real time.
Government Projects
Managing large-scale surveys and development programs efficiently.
NGOs and Social Research
Tracking field activities and monitoring program impact continuously.
Across all sectors, real-time dashboards improve visibility and operational control.
Why Expertise Still Matters
Although dashboard tools are becoming more and more accessible, their implementation will not be successful without proper planning and technical skills. Professional teams assist organizations to design KPIs, combine various data streams, automate processes, and ensure data quality across the system.
Using technology with professional guidance will guarantee that the real-time dashboards will provide valid information to facilitate growth of the business and to do research reliably.
The Future of Real-Time Dashboards
The future of real time dashboards is heading to artificial intelligence-based analytics, predictive modeling, auto-notifications, and voice recognition-based reporting solutions. As organizations keep on producing more and more data, dashboards will be even smarter and interactive.
The innovations are likely to revolutionize the way business is conducted in India, how performance is monitored and how strategic decisions are made.
Final Thoughts
No longer are real-time dashboards simply a reporting tool, but rather a strategic system that assists organizations to make smarter and faster decisions. They enhance efficiency, accuracy, and responsiveness in all industries by giving instant visibility into operations and performance.
Investment in real-time dashboards is becoming a priority among the businesses and researchers in India, in order to uphold a competitive and data-driven approach.
Looking for Real-Time Dashboard Solutions?
We offer an end-to end support on development of dashboard, live data monitoring, integration of analytics and research-driven reporting solution that will suit your business requirements.
Get in touch with us so that we can create accurate and scalable real-time dashboards that are insight-driven.
Book a free consultation for appointment
Email us at : grow@simbi.in