
GIS in Urban Planning: Applications, Data and Satellite Imagery for Smarter Cities
As the town grows, more houses, roads and shops are added every year, but the plan on the wall was created from an old survey. What is the town’s true extent? What neighbourhoods are not nearby a clinic? Which blank spaces are filled with the rain at every monsoon? GIS in urban planning can solve the question like this, by putting land use, roads, buildings, etc. on the same map, planners can measure and compare rather than guess, and answer questions like these. This guide reviews the data that GIS can provide for urban planning, the importance of satellite imagery in urban planning, the principal uses of GIS, and an example of site selection.
READ THIS ALSO: GIS Survey Services | Accurate Mapping & GIS Solutions
GIS in Urban Planning: What It Adds to the Planning Process
Maps have been used in planning all the time. The enhancements that GIS brings are the ability to attach data to each feature on a map and perform analysis on the data. The characteristics of layers are used for overlying layers to determine areas of overlap, network analysis provides a measure of the real travel along roads, and change analysis compares the same area at different times. The end result is a clear procedure that can be replicated by a different team and verified, especially when the decisions made are later questioned or reviewed.
GIS Data for Urban Planning: The Core Layers
Good analysis starts with the right layers. The table lists the ones most urban GIS projects build first.
| Data Layer | Typical Source | Planning Use |
| Land use and land cover | Classified satellite imagery and field checks | Existing land use, growth and green cover |
| Roads and transport network | Survey data, municipal records, open map data | Accessibility and traffic studies |
| Buildings and parcels | Imagery, survey data, property records | Density, zoning and ownership analysis |
| Population and households | Census and survey data | Demand for housing, schools and health care |
| Elevation and drainage | Digital elevation models, drainage maps | Flood-prone areas and site suitability |
| Utilities and facilities | Utility records, GPS surveys | Coverage gaps and maintenance planning |
Usually, these layers don’t show up in the same shape. Departments can employ various coordinate systems, scales and update frequencies, so the first step in the analysis should be the standardisation and validation of the data. Without doing this, the most frequent source of disagreement between urban GIS and what is observed in the field is this.
READ THIS ALSO: What Is GIS Survey and How Does It Work? Powerful Guide
Urban GIS and Satellite Imagery: The Base Layer for Change
Satellite imagery is often the fastest way to see how a city looks today and how it has changed. Analysts classify each pixel into classes such as built-up land, vegetation, water and bare ground, and then compare maps from different years to measure growth. How much detail you see depends on the sensor. The table compares the common choices.
| Imagery Type | Typical Detail | Best For |
| Landsat | About 30 m per pixel | City-wide growth over many years |
| Sentinel-2 | 10 m per pixel in the visible and near-infrared bands | Land cover and green cover, with frequent coverage |
| Very high resolution (commercial) | Sub-metre to a few metres | Buildings, roads and detailed base maps |
| Drone (UAV) imagery | Centimetres, for small areas | Site-level surveys and project monitoring |
Both Sentinel-2 (10 m resolution) and Landsat (coarser resolution, but with a long record) have been extensively used in city studies. Very high-resolution imagery is more expensive, but will display individual buildings. Resolution is different depending on the band and product – check the specification of the product used.
READ MORE: Advanced Remote Sensing And Satellite Imagery Services
Figure 1 shows the idea on a synthetic scene: the same area as an image-like view and as a classified land cover map.
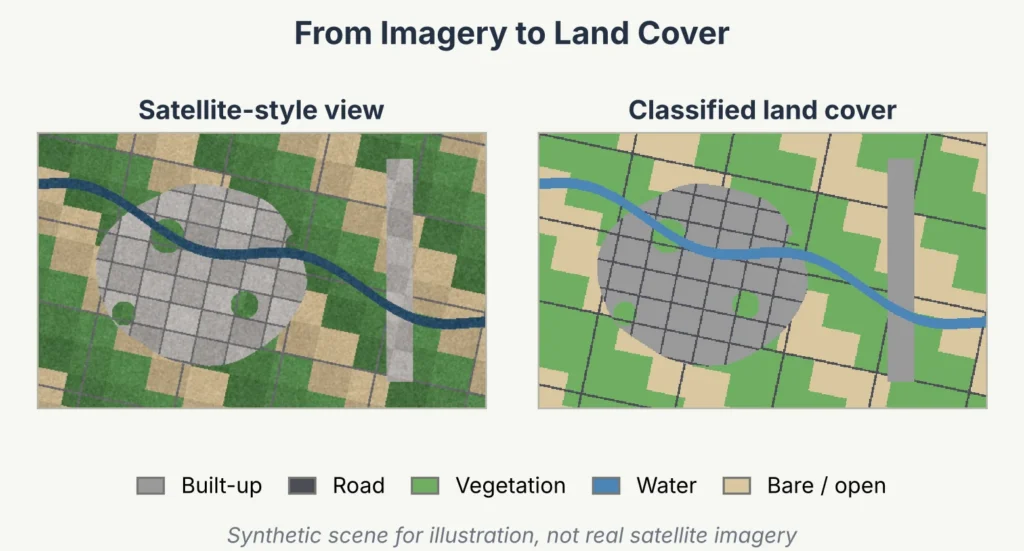
Figure 1: Imagery converted into land cover classes (synthetic scene, not real satellite imagery).
Why classification needs checking. A land cover map is a model, not a photograph. Cloud cover, shadows and mixed pixels, where one cell holds both roofs and trees, cause errors. Always compare a sample of the map with ground truth or finer imagery, and report an accuracy figure.
Useful indices. Vegetation indices such as NDVI help track green cover from multispectral imagery, and similar indices are used to highlight built-up land.
Some sample images are pasted below, which are already available there on internet.
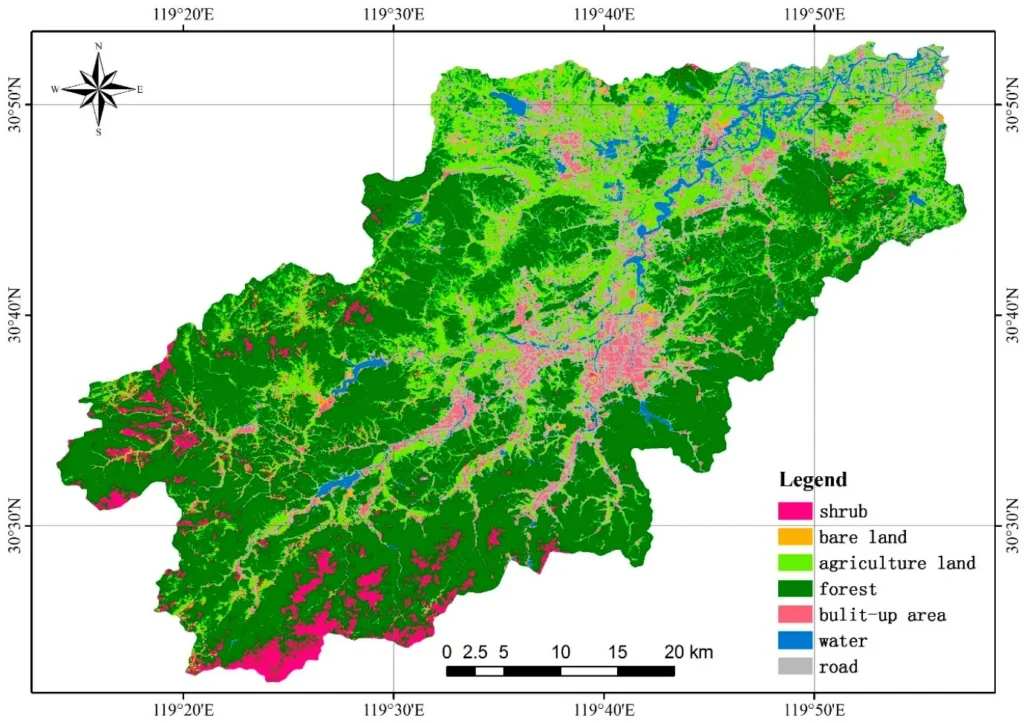
Source: MDPI
Open original research article and image
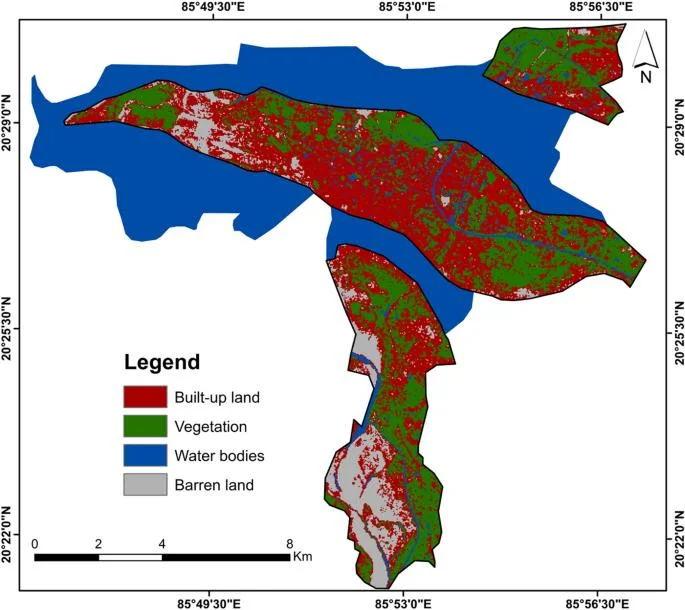
Source: Springer Nature
Open original research article and image
Utilization of GIS in Urban Planning: Six Core Uses
1. Base mapping and land use inventory
The first application of GIS in urban planning is a reliable base map. Imagery, survey data and records are combined into one up-to-date inventory of land use, buildings and roads.
2. Growth and change analysis
Comparing classified imagery from different dates shows where built-up land has expanded and what it replaced, which supports decisions on where to direct future growth.
3. Site suitability
Criteria such as road access, nearby population and flood risk are scored, weighted and combined into a suitability map. Some criteria act as exclusions, which remove land regardless of score. The worked example below shows the method.
4. Transport and accessibility
Network analysis measures travel along real roads, not straight-line distance, which matters where rivers, rail lines or restricted roads divide neighbourhoods.
5. Facilities and utilities
Mapping schools, health centres, water lines and drains against population shows where services are thin and helps rank projects by need.
6. Environmental risk
Elevation, drainage and past flood extents identify land that should be avoided or protected, so that risk is considered at the plan stage.
GIS Applications in Urban Planning: India and Beyond
The Ministry of Housing and Urban Affairs (HUA) in India has launched a sub-scheme for GIS based Master Plans for assisting the States and the Cities in Master Planning. According to one report it has been adopted in 456 towns in 35 states and union territories. AMRUT 2.0 (1st October 2021) is intended for towns with populations between 50,000 and 99,999 and is designed to include standard base maps, land use maps, master plans and GIS based urban geo-portals. Urban planning continues to be a state responsibility, and the Ministry provides advices and design standards. Please refer to the most up-to-date information on the scheme’s status from official sources due to coverage and detail changes.
In addition to master plans, newer tools are expanding the ability of GIS urban planning teams. Site level details from drone surveys, accurate elevation from LiDAR, digital archives of imagery from cloud platforms, and digital twins that connect maps with live city data. These are power additions, but not power takers.
Worked Example: Choosing a Site for a Health Centre
A municipality wants a new primary health centre. The example uses made-up scores to show the logic. It rates road access and nearby population from 0 to 10, gives them equal weight, and treats flood-prone land as an exclusion. Figure 2 shows the layers.
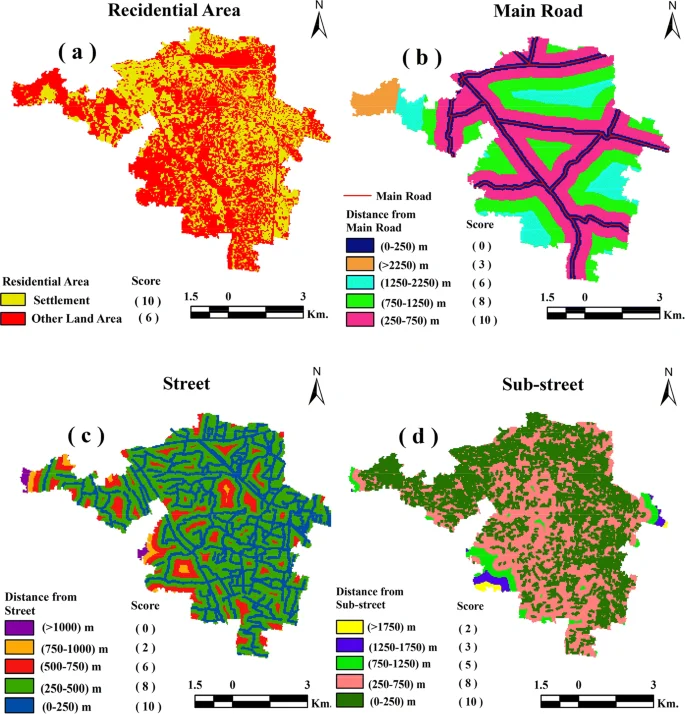
Figure 2: Layers combined by weighted overlay; A marks the highest-scoring area outside the flooded zone (illustrative).
Source: https://link.springer.com/article/10.1007/s40808-020-00852-4
The table scores three candidate parcels. Parcel A scores (8 + 9) divided by 2, which is 8.5. Parcel C scores 7.0. Parcel B would score 7.5 on access and population, but it lies on flood-prone land, so it is excluded.
| Candidate | Road Access (0-10) | Nearby Population (0-10) | Flood-Free? | Result |
| Parcel A | 8 | 9 | Yes | Score 8.5 |
| Parcel B | 9 | 6 | No | Excluded (would score 7.5) |
| Parcel C | 7 | 7 | Yes | Score 7.0 |
The steps are the same for any siting question.
- Define the goal. state what the site must achieve and who it must serve.
- Choose criteria. pick measurable layers and decide which are exclusions.
- Score and weight. rescale each layer to the same range and record the weights.
- Combine. run the weighted overlay and apply the exclusions.
- Check on the ground. visit the shortlist, because the map cannot see ownership, access disputes or local knowledge.
Limits to Keep in Mind
Data quality. Old or mismatched layers produce confident but wrong maps.
Resolution. A 10 m pixel cannot show a single house, so choose imagery to match the question.
Weights are judgements. Change the weights and the ranking can change, so test alternatives and record the reasons.
Maps support decisions. They do not replace consultation, legal review or local knowledge.
A Short Checklist for Urban GIS Projects
- Purpose. write the planning question first.
- Data audit. list sources, dates, scales and coordinate systems.
- Imagery fit. match resolution and date to the question.
- Accuracy. check classified maps against ground truth.
- Documentation. record methods, weights and limits on every map.
Simbi Labs’ GIS Survey and Mapping Support
Urban GIS is as good as the data that goes into it. Simbi Labs specializes in GIS survey and mapping services, such as field data collection, mapping and surveying, and spatial analysis for planning and decision making that is enabled by the use of GPS. Further, appointments are available on the Simbi Labs appointment page.
Frequently Asked Questions
1. What is GIS in urban planning?
It is the use of geographic information systems to map, analyse and compare land use, infrastructure, population and risk so that planning decisions rest on spatial evidence.
2.What are the main GIS applications in urban planning?
Base mapping, growth analysis, site suitability, transport and accessibility, facility and utility planning, and environmental risk assessment.
3. What GIS data for urban planning is needed first?
Land use and land cover, roads, buildings and parcels, population, elevation and drainage, and utilities and facilities.
4. How is satellite imagery used in urban GIS?
It is classified into land cover and compared across dates to measure growth, green cover and change.
5. How does GIS for urban planning help choose sites?
It scores and weights criteria such as access and population, applies exclusions such as flood-prone land, and ranks the remaining parcels.
6. What is an example of application of GIS in urban planning in India?
GIS-based master plans under an AMRUT sub-scheme, and the geo-portals and base maps planned under AMRUT 2.0.
7. What does GIS urban planning not replace?
Field verification, legal review, public consultation and local knowledge.