
Divergent Trends in Canopy Greenness and Vegetated Extent Around the Bandel Thermal Power Station
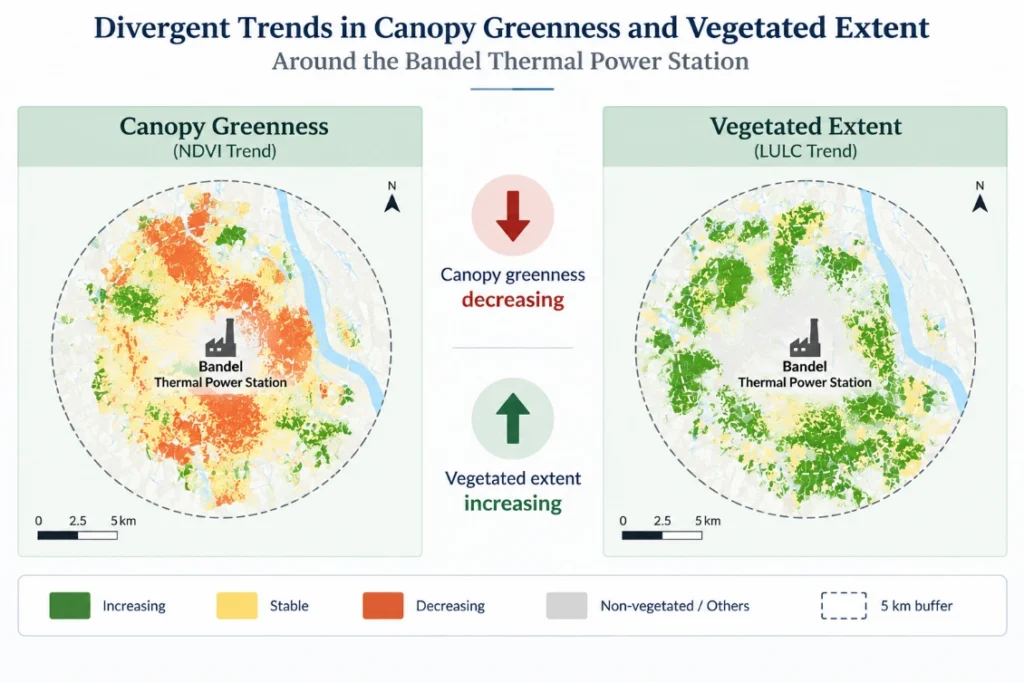
A thirty-year Landsat record of the Bandel Thermal Power Station (BTPS) in Hooghly district, West Bengal, shows two vegetation indicators moving in opposite directions over the same ground and the same dates. Mean NDVI, the standard measure of canopy greenness, rose steadily across the study period. Vegetated extent, the mapped area actually carrying vegetation, rose slightly and then fell, ending lower than where it started. The two measures do not agree, and understanding why is more useful than assuming either one alone tells the full story.
Canopy greenness and vegetated extent answer different questions, and a landscape in transition can show one improving while the other declines over the identical period. The record comes from a peer-reviewed distance-stratified study built on Landsat 4 TM, Landsat 5 TM and Landsat 8 OLI scenes acquired in April 1989, 2005 and 2019, within a 5 km buffer around BTPS. The findings below are drawn directly from that study and are reported as description rather than as proof of the plant’s effect, a distinction the original research is careful to maintain throughout.
Bandel Thermal Power Station and the Study Design
BTPS stands at 22.9952 degrees N, 88.4053 degrees E near Tribeni, on the western bank of the Hugli River, about 50 km north of Kolkata. Commissioned in 1965 under the West Bengal Power Development Corporation Limited, it was the state’s first thermal power project, starting with four units of 82.5 MW nameplate capacity and gaining a fifth 210 MW unit in 1983. Electrostatic precipitators were fitted to all five units in 1996-97, and the two least efficient units were shut down by 2018, leaving an operating capacity of 335 MW.
The study area is a circular 5 km radius buffer around the plant, covering 78.54 square kilometres across parts of Balagarh, Chinsurah-Mogra and Polba-Dadpur blocks in Hooghly district and part of Chakdah block across the river in Nadia district. The surrounding land is overwhelmingly agricultural, a double- to triple-cropped rice tract, rather than forest, which matters directly for how the results should be read.
To capture how influence might change with distance from the source, the buffer was split into five concentric 1 km wide rings, or annuli, and every measurement was compiled separately for each ring at each of the three dates.

Measuring Vegetated Extent and Canopy Greenness
The study treats vegetated extent and canopy greenness as two separate measurements rather than one combined score.
- Vegetated extent: the mapped area classified as cropland, plantation or shrub and open forest, obtained through supervised maximum-likelihood classification of each Landsat scene.
- Canopy greenness: the condition of that vegetation, captured through NDVI and seven spectral indices sensitive to chlorophyll, biomass, canopy structure and leaf moisture.
- Composite index: the seven indices, GCI, GI, MCARI2, GNDVI, GRVI, RDVI and MSI, were combined into a single Composite Vegetation Health Index using weights derived from Saaty’s Analytic Hierarchy Process.
This separation of extent from condition is what allows the divergence to be seen at all. A study reporting only one of the two measures would have missed the pattern entirely.
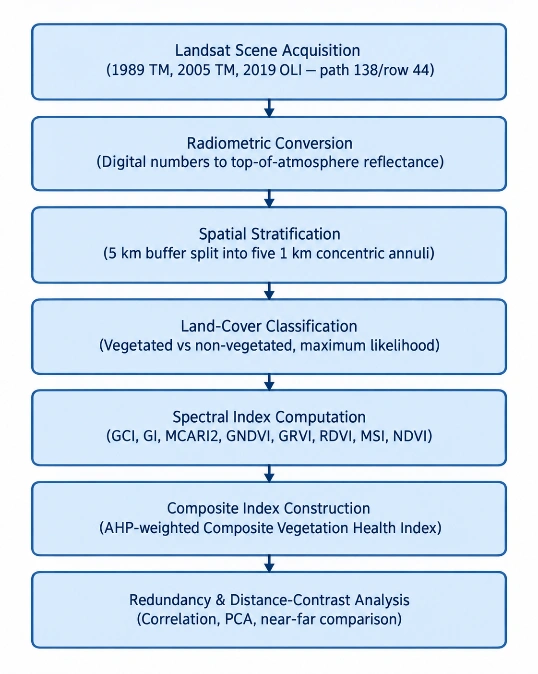
Geospatial Methodology Used in the Study
The analysis followed a structured sequence, moving from raw satellite scenes to a set of comparable indicators for each of the five distance rings and three dates.
Vegetated Extent Across the Study Buffer
Total vegetated area within the 5 km buffer was 5,389.69 hectares in 1989, rising slightly to 5,442.10 hectares in 2005, then falling to 5,039.45 hectares in 2019. Across the full thirty-year record this is a net loss of 350.24 hectares, or 6.5% of the 1989 total, and the loss was not evenly spread.
- Between 1989 and 2005, four of the five distance rings gained vegetated area, and only the outermost 4-5 km ring lost ground, by 49.59 hectares.
- Between 2005 and 2019, the pattern concentrated sharply: the outermost 4-5 km ring alone lost 310.26 hectares, accounting for 77.1% of the 402.65 hectare net loss in that period.
- The two innermost rings, within 2 km of the plant, together gained 33.35 hectares over the full 1989-2019 record, even as the buffer overall lost vegetation.
- The innermost 1 km ring rose from 25.4% vegetated in 1989 to 38.7% in 2005 before settling at 34.3% in 2019, consistent with plantation or green-belt development on the plant’s own land.
Over the whole buffer, the vegetated fraction of total land area was 68.6% in 1989, 69.3% in 2005 and 64.2% in 2019, tracking the same rise-then-fall pattern as the absolute hectare figures.
Vegetated Fraction by Distance Ring
The table below summarises how the vegetated share of each 1 km ring changed across the three survey dates.
| Distance Ring | 1989 | 2005 | 2019 | Trend |
| 0-1 km | 25.4% | 38.7% | 34.3% | Net gain |
| 1-2 km | 62.0% | 62.2% | 62.6% | Stable |
| 2-3 km | 68.5% | 69.3% | 68.3% | Stable |
| 3-4 km | 70.1% | 72.1% | 69.1% | Slight loss |
| 4-5 km | 74.6% | 72.9% | 61.9% | Largest loss |
Explanation Behind the Divergence
The study attributes the divergence to a compositional effect rather than to any improvement or decline in plant physiology. Mean greenness is calculated across whatever pixels remain classified as vegetated. Where the pixels leaving the vegetated pool are systematically the least green, such as sparse scrub, degraded field margins and thinly vegetated peri-urban land, the average of what remains rises by arithmetic selection alone, with no change required in the health of any individual plant.
- Loss follows settlement geography: 77% of the 2005-2019 net loss fell in the outermost ring, farthest from the plant and nearest the expanding urban fringes of Bansberia and the Hugli-Chinsurah complex, rather than concentrating near the station as an emissions-driven pattern would.
- Index minimums fell over time: the lowest NDVI value recorded dropped from 0.18 in 1989 to minus 0.33 in 2019, indicating an expanding non-vegetated surface within the buffer.
- Variation narrowed as the low tail was removed: the coefficient of variation fell on every greenness index between 1989 and 2005, the signature of a distribution losing its sparsest members.
- Innermost-ring gains point to land management, not emissions relief: the two rings closest to the plant gained vegetated area even as the wider buffer lost it, most plausibly reflecting plantation or green-belt planting on the station’s own premises.
The study draws a direct contrast with earlier work around the Singrauli coalfield, where forest conversion removes dense, high-NDVI cover and the mean of what remains falls. Around BTPS the surrounding land is cultivated rather than forested, so the vegetation being lost is sparse rather than dense, and the same compositional process produces the opposite sign.

Redundancy Among the Seven Spectral Indices
A separate strand of the study tested whether combining seven different spectral indices into one weighted composite actually adds information over using a single index. The seven indices correlated with each other between 0.904 and 1.000, and their first principal component alone explained 84.3% of total variance, giving an effective dimensionality of just 1.62 across the full set.
- The Analytic Hierarchy Process composite correlated at r = 0.997 with a simple equally weighted composite.
- It correlated at r = 0.989 with the first principal component of the seven indices taken together.
- It correlated at r = 0.994 with RDVI alone and r = 0.984 with GCI alone, the lowest of these four comparisons.
- GCI and GRVI turned out to be algebraically identical in this study’s formulation, since GCI equals GRVI minus one pixel by pixel, so the two together carried 38.5% of the composite’s assigned weight without contributing independent information.
The practical conclusion is that an elaborately weighted seven-index composite represented canopy condition no better than a single well-chosen index such as RDVI. The study recommends that future composite-index work report the correlation matrix of its components and check for this kind of redundancy before assigning weights.
Relevance for Environmental and Land-Monitoring Programmes
| Aspect | Canopy Greenness (Condition-Based Indicator) | Vegetated Extent (Area-Based Indicator) |
| What it measures | The condition and greenness of existing vegetation, often using spectral indices such as NDVI | The total area covered by vegetation |
| Operational relevance | Used to assess vegetation health and condition | Used in forest-cover statistics, land-degradation accounting, and SDG 15 monitoring |
| Possible interpretation | Mean NDVI may indicate improvement in vegetation condition | Vegetated area may indicate a simultaneous decline in overall vegetation coverage |
| Potential monitoring issue | Can show apparent improvement when sparse vegetation is lost and denser vegetation remains | Can reveal vegetation-area loss that may not be visible through mean NDVI alone |
| Key implication | Should not be interpreted independently | Should not be interpreted independently |
| Recommended approach | Report together with vegetated extent for the same area and dates | Report together with canopy greenness for the same area and dates |
| Overall benefit | Provides information about vegetation quality and condition | Provides information about the quantity and spatial extent of vegetation |
Turn Vegetation and Satellite Data Into Actionable Insight
Distance-stratified satellite records of this kind are inexpensive to build and give industries, regulators and researchers a descriptive baseline for landscapes that otherwise have no ground monitoring. Simbi Labs supports organisations with GIS survey and geospatial analysis services, helping map vegetation extent, canopy condition and land-use change around industrial and infrastructure sites using satellite imagery and remote sensing techniques.
Need Help With GIS & Vegetation Analysis?
Accurate analysis of canopy greenness is essential for understanding vegetation changes, environmental patterns, and ecosystem health. If you need help with GIS, remote sensing, spatial analysis, or research data interpretation, our experts at Simbi Labs can assist with reliable analysis and research support.
Book a free consultation for appointment
Email us at : grow@simbi.in
Frequently Asked Questions
1. Meaning of divergent trends in canopy greenness and vegetated extent
It describes a situation, documented in this study, where mean NDVI rose steadily from 0.28 to 0.57 between 1989 and 2019 while the mapped vegetated area fell by 350 hectares, or 6.5%, over the same period and the same landscape.
2. Location and background of the Bandel Thermal Power Station
BTPS is a coal-based station on the Hugli River in Hooghly district, West Bengal, commissioned in 1965 as the state’s first thermal power project, with electrostatic precipitators fitted to all units in 1996-97.
3. Cause of the divergence identified by the study.
The study attributes it to a compositional effect: the land leaving the vegetated pool was systematically sparse and low in greenness, so the average of the vegetation that remained rose by selection, without requiring any change in individual plant health.
4. Number of spectral indices used and their independence.
Seven indices were used alongside NDVI, but their first principal component explained 84.3% of total variance, meaning the set carried an effective dimensionality of only about 1.62 rather than seven independent dimensions.
5. Whether the study proves the power station caused the vegetation changes.
No. The authors state explicitly that the design describes a distance-stratified record rather than establishing a causal effect, since it lacks a control area, wind-direction stratification and a clean pre- and post-retrofit comparison window.