
Data Analytics vs Statistics: Key Differences Explained
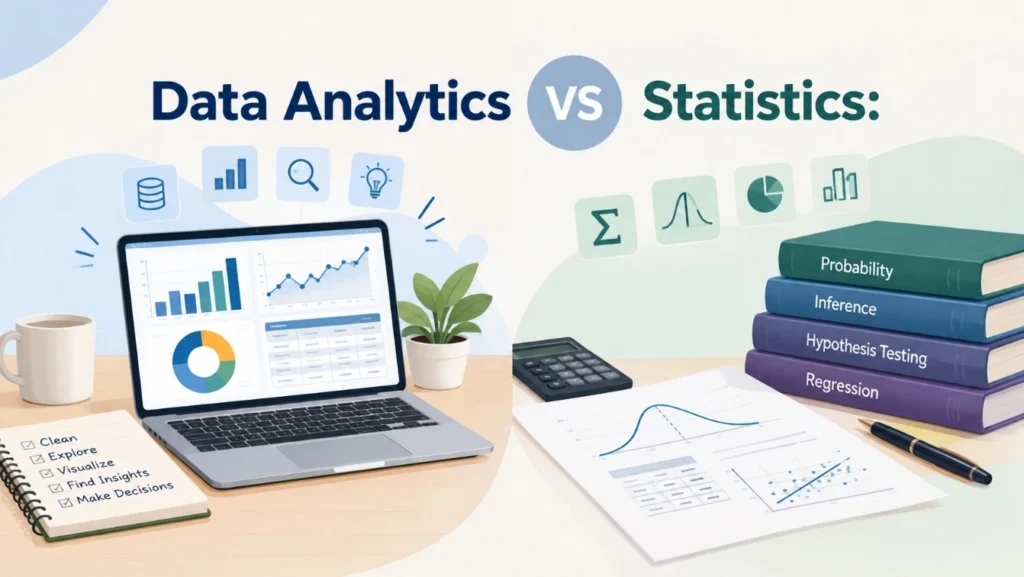
Data has become central to research, business, healthcare, finance, and technology. However, collecting data is only the first step. Organisations need appropriate methods to analyse data, identify patterns, and support decisions.
This is where data analytics and statistics overlap. Although they are closely related, they have different purposes. Statistics focuses on mathematical methods for understanding data, uncertainty, and relationships, while data analytics takes a broader approach that can include statistics, programming, visualisation, databases, and predictive modelling.
Understanding the difference between data analytics and statistics helps professionals select the right approach for a particular problem.
READ THIS ALSO: Business Analytics vs Data Analytics: Powerful Key Differences
The Foundations of Statistics
Statistics is the discipline of collecting, organising, analysing, interpreting, and presenting data. It is particularly useful for understanding variation, testing hypotheses, estimating population characteristics, and determining whether observed relationships are statistically meaningful.
Statistics generally includes:
1. Descriptive statistics – summarising data using means, medians, percentages, and measures of variation.
2. Inferential statistics – using sample data to draw conclusions about a larger population through methods such as hypothesis testing, regression, ANOVA, t-tests, and chi-square tests.
For example, a researcher studying employee productivity may compare scores before and after a training programme to determine whether the improvement is statistically significant.
Example
If five productivity scores are 60, 70, 75, 80, and 90:
Mean = ΣX / N
Mean = (60 + 70 + 75 + 80 + 90) / 5 = 75
This gives a basic summary of the dataset. Additional statistical tests can determine whether differences or relationships are significant.
Understanding Data Analytics
Data analytics is the broader process of examining data to discover patterns, answer questions, generate insights, and support decisions.
A typical analytics process is:
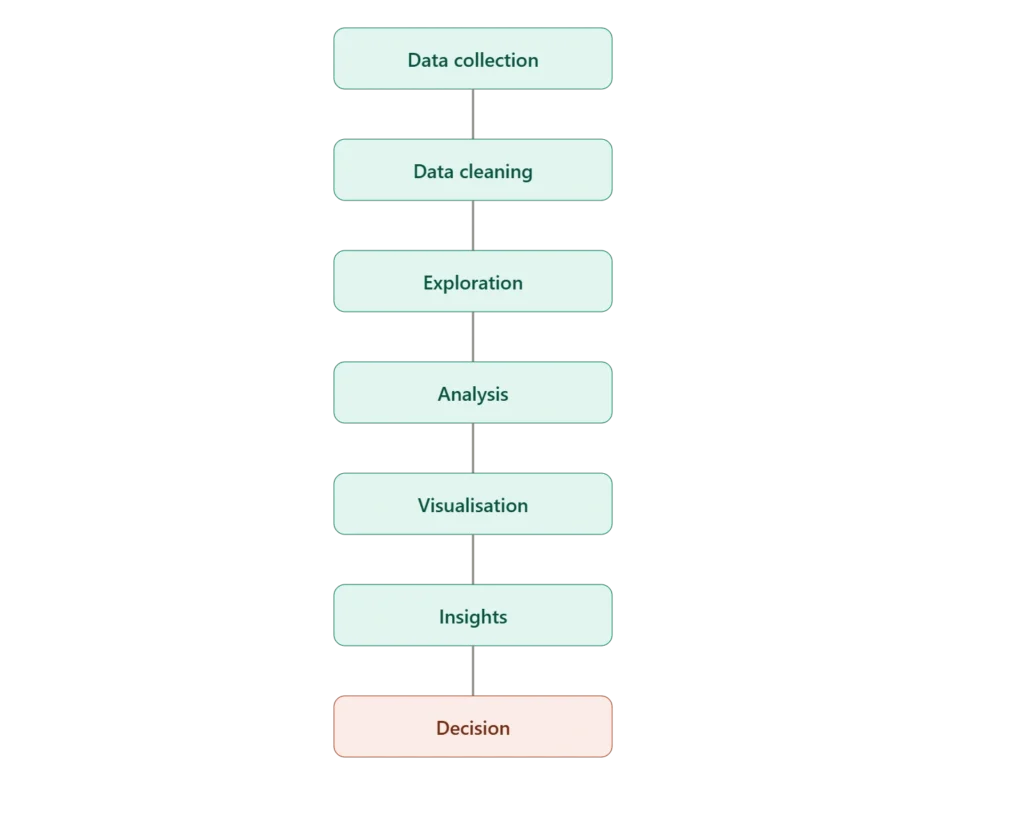
Data analytics can use statistical methods along with Python, R, SQL, Excel, Power BI, Tableau, and machine learning.
For example, an e-commerce company can analyse sales data to identify high-performing products, changing customer behaviour, and purchasing trends.
Data Analytics vs Statistics: Key Differences
| Aspect | Statistics | Data Analytics |
| Main focus | Statistical conclusions and uncertainty | Insights and decision-making |
| Foundation | Mathematics and probability | Statistics, computing and domain knowledge |
| Common methods | Regression, ANOVA, hypothesis testing | Statistical analysis, dashboards, forecasting, modelling |
| Typical output | Estimates, relationships, statistical conclusions | Reports, insights, predictions and recommendations |
| Applications | Research, science, experiments | Business, healthcare, finance and operations |
Data Analysis vs Statistical Analysis
The data analytics vs statistical analysis comparison becomes clearer when considering their typical questions.
Statistical analysis may ask:
“Is this relationship statistically significant?”
Data analytics may ask:
“What happened, why did it happen, and what action should be considered?”
Analytics can combine statistical analysis with data visualisation, programming, predictive modelling, and business intelligence.
Data Analysis vs Statistics
The distinction between data analysis vs statistics mainly concerns scope.
Statistics provides mathematical methods and principles for understanding data and uncertainty. Data analysis is the practical process of working with data to answer a specific question.
For example, a hospital may use statistics to test whether a new workflow significantly reduces patient waiting time. A broader data analysis project could involve cleaning patient records, identifying trends, creating visualisations, and reporting operational findings.
Choosing the Right Approach
| Approach | Use It When | Practical Example |
| Statistics | You need to test hypotheses or make population inferences | Testing whether training significantly improves employee productivity |
| Data Analysis | You need to explore, clean, summarise, or understand data | Analysing sales data to identify declining product categories |
| Data Analytics | You need insights to support decisions or predictions | Using hospital data to identify emergency department crowding trends |
| Statistical Analysis | You need to measure relationships, differences, or significance | Using regression to study how advertising spending affects sales |
Descriptive, Diagnostic, Predictive and Prescriptive Analytics
Data analytics can address different levels of decision-making:
| Type | Question | Example |
| Descriptive | What happened? | Sales declined by 8% |
| Diagnostic | Why did it happen? | A product category lost demand |
| Predictive | What may happen next? | Forecasting future sales |
| Prescriptive | What action could help? | Adjusting inventory based on demand forecasts |
Example: Healthcare
Consider a hospital trying to reduce emergency department waiting times.
The hospital can collect information about patient arrival time, triage category, diagnostic turnaround, treatment duration, admission, and discharge.
Statistical analysis can determine whether waiting times differ significantly between patient groups or whether a new process produces measurable improvement.
Data analytics can combine these results with dashboards, historical trends, and predictive models to identify developing bottlenecks and support operational decisions.
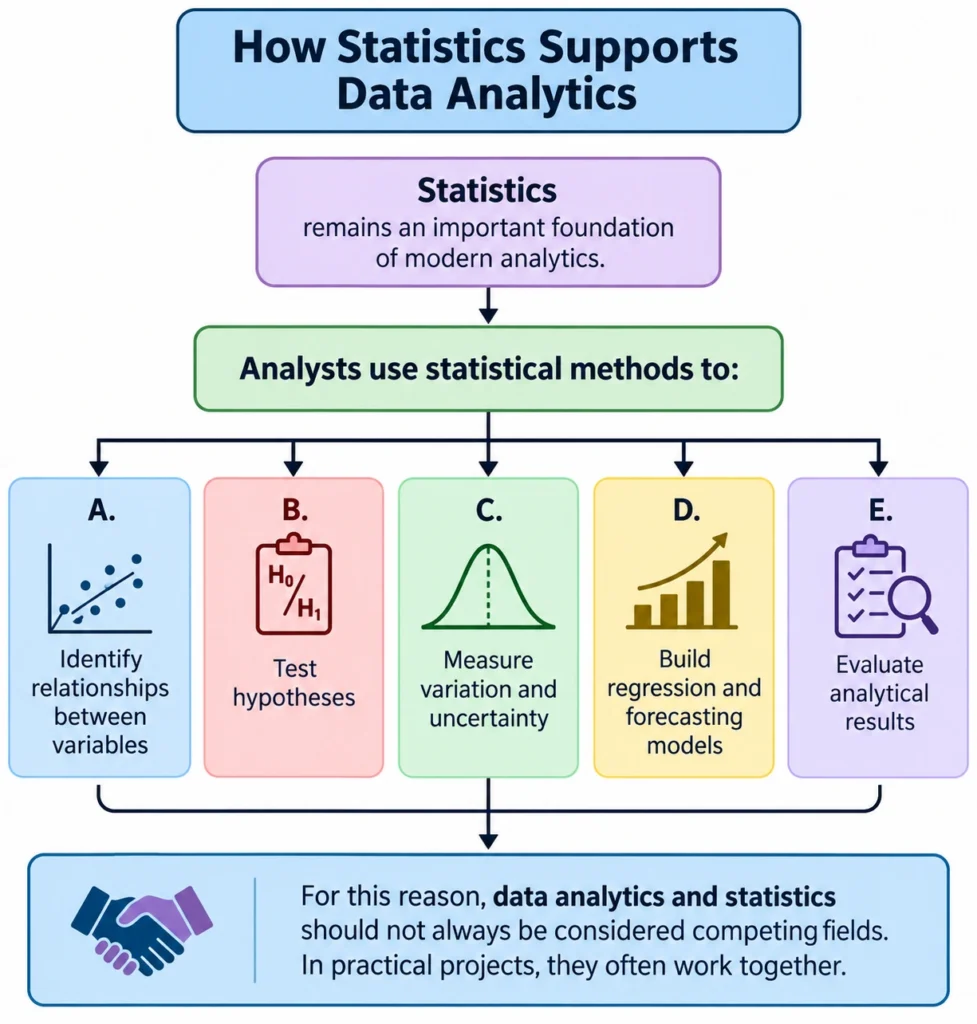
This shows how statistics can contribute to a larger analytics workflow.
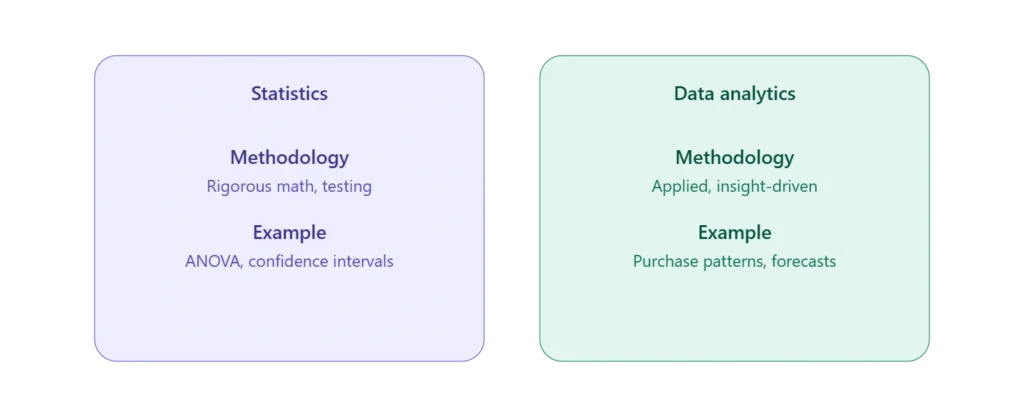
Methodologies and focus
Understanding the Difference Between Data Analytics and Statistics
The difference between data analytics and statistics is primarily one of scope and application.
Statistics provides mathematical and probabilistic methods for analysing data, testing assumptions, measuring uncertainty, and drawing conclusions.
Data analytics uses these methods alongside technology, data management, visualisation, modelling, and domain knowledge to generate actionable insights.
The relationship can be simplified as:
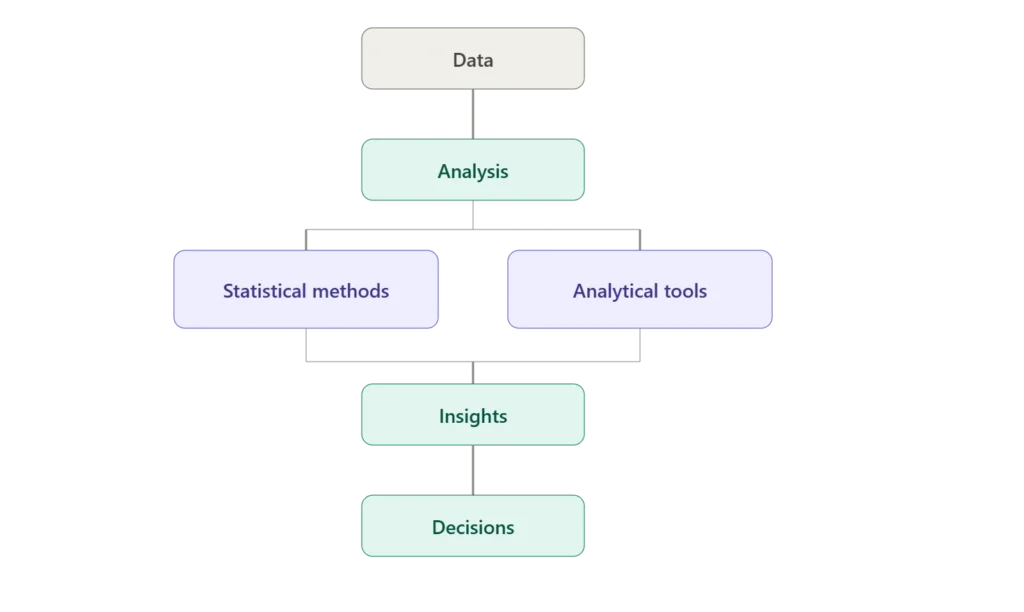
Understanding this relationship helps organisations select appropriate methods instead of treating data analytics and statistics as completely separate disciplines.
Making Data More Meaningful
The real value of data lies not simply in collecting it, but in knowing how to interpret and apply it. Statistics provides the foundation for reliable analysis, while data analytics extends that foundation into practical insights, predictions, and informed decisions. When used together, they help organisations move from raw data to evidence-based action with greater clarity and confidence. The right approach depends on the question being asked, the nature of the data, and the decision that needs to be supported.
Make Data Work for You
The right combination of statistics, data analysis, and data analytics can transform complex data into meaningful insights and informed decisions.
Simbi Labs offers professional statistical and data analytics solutions to help researchers and organisations analyse data with clarity and confidence.
Connect with Simbi Labs to turn your data into reliable, actionable insights.
Email: grow@simbi.in
Frequently Asked Questions
1. What is the difference between data analytics and statistics?
Statistics focuses on mathematical methods for analysing data and measuring uncertainty, while data analytics has a broader focus on generating insights and supporting decisions.
2. Is data analysis the same as statistical analysis?
No. Data analysis is broader, while statistical analysis specifically uses statistical methods to investigate relationships, differences, and significance.
3. What is the difference between data analysis and statistics?
Statistics is a mathematical discipline, whereas data analysis is the practical process of examining and interpreting data to answer specific questions.
4. How are data analytics and statistical analysis related?
Statistical analysis is often one component of data analytics. Analytics can combine statistical methods with programming, visualisation, databases, and predictive modelling.
5. Can statistics be used in data analytics?
Yes. Regression, hypothesis testing, correlation, forecasting, probability, and other statistical methods are commonly used in data analytics.