
Crowd Flow Analysis: Understanding Pedestrian Movement
Crowd flow analysis is the discipline of measuring, modelling and managing how people move through a shared space, so that the space can be designed or operated to keep that movement safe and efficient. As stadiums, transit hubs, religious gatherings and urban events continue to grow in scale, crowd flow analysis has moved from a specialist safety-engineering exercise to a standard part of planning for any venue that expects a dense or time-concentrated crowd. Crowd flow analysis quantitatively studies pedestrian movement, density and behaviour to identify congestion risks, assess design changes and support safety planning. It combines traffic engineering, pedestrian behaviour research, urban planning, event safety management and transportation engineering for spaces such as stations, stadiums and public squares.
READ MORE: Crowd Control Management Plan: Strategies for Safer Events
The Process of Analysing Pedestrian Movement
Pedestrian movement is analysed by converting observed or simulated positions of people over time into a small set of measurable quantities, flow rate, density and speed, that describe how a crowd is behaving at any point in a space.
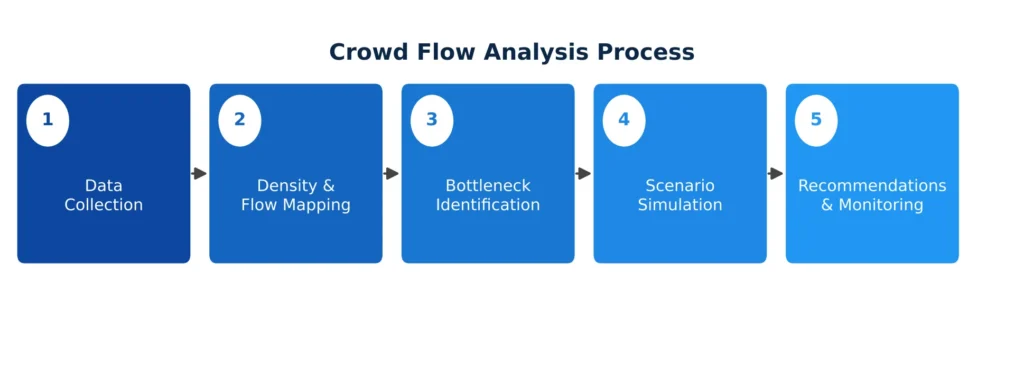
Figure 1: The core stages used to turn raw pedestrian observation into actionable findings.
Three main categories of data feed this process:
- Direct observation and counting: trained observers or video review recording how many people cross a defined line in a given period.
- Automated sensing: CCTV with computer-vision analytics, Wi-Fi and Bluetooth signal detection, thermal or infrared sensors, and turnstile or ticket-scan logs, all of which can produce continuous counts without manual effort.
- Simulation and modelling: software such as agent-based microsimulation tools reproduces pedestrian behaviour under hypothetical conditions, letting planners test a design before it is built or a crowd ever arrives.
These inputs are related through what is often called the fundamental diagram of pedestrian flow: as density increases, average walking speed falls, and flow rate (the product of density and speed) first rises, then peaks, then collapses once density becomes high enough that people can barely move at all. Recognising which side of that peak a location is operating on is the central judgment call in any crowd flow analysis.
Key Metrics in Crowd Flow Analysis
A small set of standardised metrics makes it possible to compare locations, track change over time, and set clear safety thresholds.
| Metric | What It Measures | Typical Unit | Why It Matters |
| Pedestrian Flow Rate | Number of people passing a point per unit time, per metre of width | persons/min/m | Shows whether a passage can clear arriving demand |
| Pedestrian Density | Number of people occupying a unit area | persons/m² | Core input to safety thresholds and Level of Service grading |
| Walking Speed | Average pace of movement through an area | m/s | Falls sharply as density rises, an early warning sign |
| Level of Service (LOS) | A–F grading of comfort and safety at a given density (Fruin scale) | Grade A–F | Common reference point in venue and transit design |
| Queue Length | Number of people or metres waiting at a control point | persons / m | Direct indicator of a point exceeding its throughput capacity |
| Dwell Time | Time a person spends stationary in an area | seconds / minutes | Highlights congestion caused by waiting rather than movement |
The Level of Service scale, originally developed by John Fruin, remains the most widely cited reference point: it grades a walkway or standing area from A (free movement, no interference between individuals) through to F (severe congestion, with involuntary contact and a real risk of crowd crush). Most venue safety guidance sets an operating target of LOS C or better in normal conditions, with contingency plans triggered well before conditions reach LOS E or F.
Tracking these metrics over time, rather than as a single snapshot, is what reveals a developing problem. The chart below, from the worked example later in this guide, shows how an entrance’s inflow rate can climb well past its design capacity during a short peak window even though its average rate across the full event looks unremarkable.
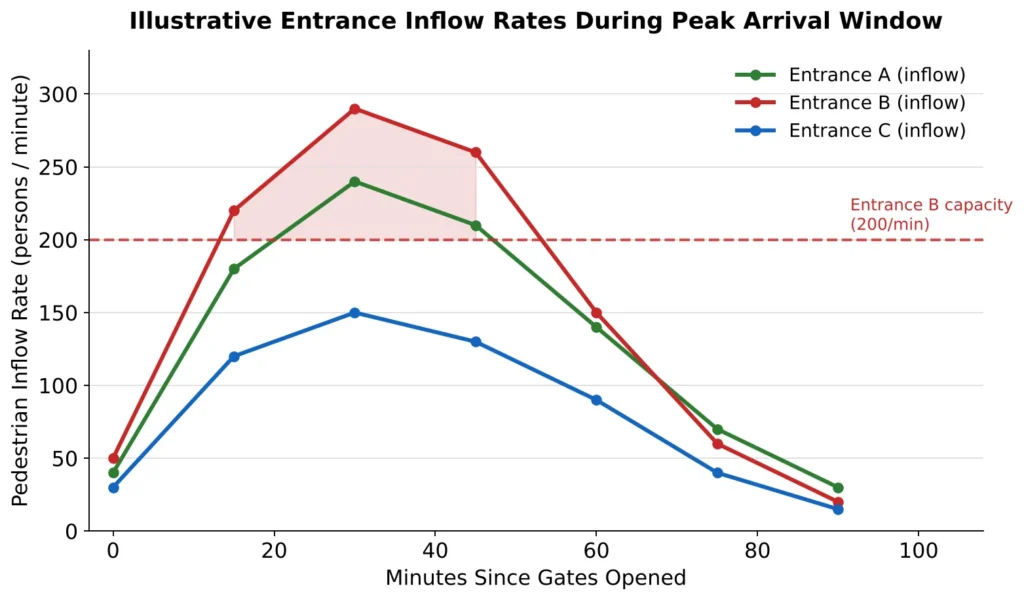
Figure 2: Illustrative inflow-rate tracking at three event entrances, showing one exceeding its design capacity during the peak arrival window.
Identifying Pedestrian Bottlenecks
A bottleneck is any point where the demand for pedestrian throughput exceeds the physical capacity available to carry it, causing queuing, density build-up and falling walking speed immediately upstream. Because capacity is set by the narrowest or slowest point along a route, a handful of location types account for the large majority of real-world bottlenecks.
| Location Type | Why It Is Prone to Congestion | Typical Mitigation |
| Narrow Walkways | Effective width drops below what the approaching flow requires | Widen the path, or divert a portion of flow to a parallel route |
| Entrances and Exits | Demand is concentrated into a single controlled opening | Add lanes, stagger opening times, increase effective width |
| Stairways | Speed drops and vertical movement reduces achievable flow rate | Separate up and down flows, add handrail capacity, widen treads |
| Corridors | Two-way or merging flows reduce the usable width for each direction | Lane markings, one-way routing during peak periods |
| Ticketing Areas | Processing time per person is slower than the arrival rate | Add counters or scanners, pre-validate tickets before arrival |
| Transport Stations | Scheduled arrivals release large groups into the same space at once | Platform-edge management, staggered dispersal routing |
| Intersections | Multiple streams cross the same point at the same time | Signal or steward-controlled right-of-way, physical separation |
| Conflicting Pedestrian Flows | Opposing or crossing movements interfere with one another’s speed | Directional separation, one-way systems, timed access windows |
In practice, a single location often combines several of these risk factors at once, a ticketing area that also functions as a narrow entrance corridor, for example, which is why crowd bottleneck analysis treats each access point as a combination of its physical geometry, its processing rate and the direction and timing of the flows that converge on it.
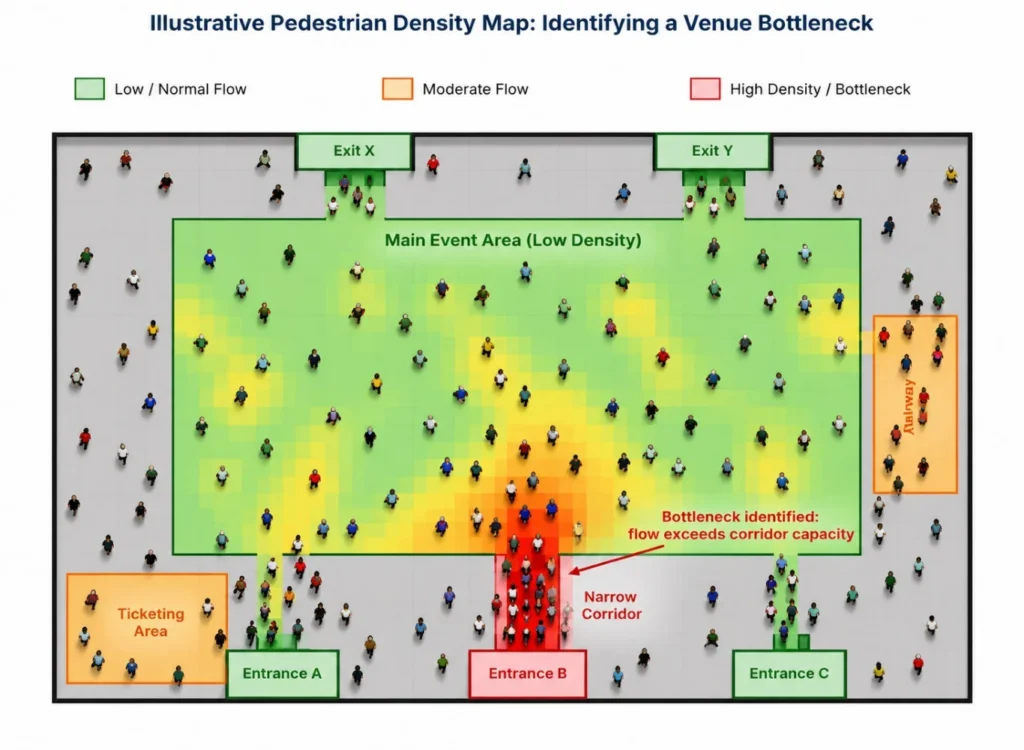
Figure 3: An illustrative density map highlighting a bottleneck caused by a narrow approach corridor at one entrance.
Crowd Flow Analysis Methods
Several complementary methods are used, often in combination, depending on the scale of the venue and the stage of the project.
Manual Observation and Counting
Trained observers record counts at defined points, either live or from recorded video. This remains useful for smaller venues, spot checks, or validating the output of automated systems.
Video Analytics and Computer Vision
Camera feeds are processed with object-detection and tracking algorithms to generate continuous, automated counts, density estimates and even individual trajectory data across large areas without additional staffing.
Sensor-Based Tracking
Wi-Fi and Bluetooth signal detection, thermal imaging and LiDAR sensors estimate occupancy and movement patterns, particularly useful where cameras are impractical or where anonymised counting is preferred.
Simulation and Modelling
Agent-based microsimulation models each pedestrian as an individual responding to the people and obstacles around them, while macroscopic models treat the crowd as a continuous flow, similar to fluid dynamics. Both approaches let a design be stress-tested against a range of arrival scenarios before it is built or an event takes place.
Crowd Flow Analysis Process
Regardless of method, a complete crowd flow analysis process generally follows the same sequence:
- Define the Objective and Scope: Clarify whether the goal is new design, event planning, or investigating an existing problem, and which areas of the venue are in scope.
- Conduct a Site Audit and Mapping: Record the physical layout, widths, gradients, and the location of every entrance, exit, stairway and potential chokepoint.
- Collect Movement Data: Gather counts and density data using the appropriate combination of manual, sensor-based or video-analytics methods.
- Calculate Core Metrics: Convert raw counts into flow rate, density, speed and Level of Service for each key location.
- Identify Bottlenecks: Compare observed or modelled demand against the physical capacity of each access point and route segment.
- Run Scenario Simulations: Test the effect of proposed changes, additional lanes, rerouted flows, staggered entry, before committing to them.
- Issue Recommendations: Translate findings into specific design changes, staffing plans, signage or queue-management procedures.
- Monitor and Validate: Re-measure after changes are implemented to confirm the intended improvement was actually achieved.
Example: Pedestrian Flow Analysis at a Large Event
The following illustrative example walks through a complete pedestrian flow analysis for a single-day outdoor event expecting 10,000 visitors, arriving through three entrances and leaving through two exits.
With 10,000 visitors expected and the bulk of arrivals concentrated into the ninety minutes around gate opening, the analysis team began by recording pedestrian counts at each entrance in fifteen-minute intervals, alongside density readings in the immediate approach area of each gate.
| Access Point | Effective Width | Design Capacity | Peak Observed Inflow | Status |
| Entrance A | 4.0 m | 300 persons/min | 240 persons/min | Within capacity |
| Entrance B | 2.6 m (narrows to 2.0 m) | 200 persons/min | 290 persons/min | Exceeded – bottleneck |
| Entrance C | 3.2 m | 180 persons/min | 150 persons/min | Within capacity |
| Exit X | 4.5 m | 340 persons/min | – | Adequate |
| Exit Y | 4.0 m | 300 persons/min | – | Adequate |
The data showed Entrance A and Entrance C comfortably handling their peak inflow within design capacity. Entrance B, however, fed by a corridor that narrowed from 2.6 metres to just 2.0 metres roughly ten metres before the gate, saw inflow reach 290 persons per minute against a design capacity of only 200 persons per minute during the thirty-minute mark, exactly the pattern visible in Figure 2 above.
With the bottleneck identified, the team tested an alternative routing option in simulation: diverting a portion of arriving visitors away from the narrow corridor toward Entrance C via a secondary side path. This reduced Entrance B’s peak inflow to a more manageable level while keeping Entrance C comfortably within its own capacity, avoiding simply relocating the same problem elsewhere.
Based on the combined findings, the final queue-management recommendation included three elements: opening the secondary side path as a permanent second approach to Entrance B rather than an emergency measure, staggering ticket-holder arrival windows by seating block to flatten the thirty-minute peak, and stationing additional stewards at the corridor’s narrowest point to maintain one-way flow during the highest-demand period.
Crowd Flow Analysis Support from Simbi Labs
Simbi Labs works with event organisers, venue operators and planning teams to carry out end-to-end crowd flow analysis, from baseline site audits and data collection through simulation, bottleneck identification and the design of practical, implementable queue-management and safety recommendations.
Book a free consultation for appointment
Call Now : +91 99505 66669
Email : grow@simbi.in
Frequently Asked Questions
1. What is crowd flow analysis?
Crowd flow analysis is the study of how pedestrians move through a space, using measured or simulated data on flow rate, density and speed to identify congestion risk and inform design or operational decisions.
2. What is the difference between crowd flow analysis and pedestrian flow analysis?
The terms are generally used interchangeably. Some practitioners use “pedestrian flow analysis” for routine movement studies, such as station or office layouts, and reserve “crowd flow analysis” for scenarios involving dense, event-scale crowds, but the underlying methods and metrics are the same.
3. Which locations are most likely to become bottlenecks?
Narrow walkways, entrances and exits, stairways, corridors with merging or crossing flows, ticketing areas, transport stations, intersections and points of conflicting pedestrian flow account for the majority of real-world bottlenecks.
4. What is Level of Service in the context of pedestrian analysis?
Level of Service, or LOS, is an A-to-F grading scale, originally developed by John Fruin, that describes pedestrian comfort and safety at a given density, from free, unimpeded movement at LOS A to severe congestion at LOS F.
5. Do small venues need a formal crowd flow analysis?
The depth of analysis should match the risk. A small venue with predictable, low-density footfall may only need a basic site audit, while any venue expecting dense, time-concentrated crowds, regardless of overall size, benefits from at least a basic pedestrian flow analysis covering its entrances, exits and any narrow points.
6. What tools are commonly used for crowd flow simulation?
Widely used simulation platforms include agent-based microsimulation tools that model individual pedestrian behaviour, alongside video-analytics systems and sensor-based tracking for collecting the real-world data that calibrates those simulations.