
Monte Carlo Simulation in NetLogo: A Clinical Trial Case Study
Introduction
Monte Carlo simulation is a statistical technique that uses repeated random sampling to estimate the probability of different outcomes. It is widely applied in engineering, finance, healthcare, and biostatistics to study systems affected by uncertainty. Rather than relying on a single prediction, Monte Carlo simulation performs the same experiment many times with randomly generated values, allowing researchers to observe the range and likelihood of possible outcomes.
Although NetLogo is primarily recognized for agent-based modeling, it also provides an intuitive platform for demonstrating Monte Carlo concepts. In this case study, a simple NetLogo model was developed to simulate a hypothetical clinical trial evaluating the effectiveness of a new blood pressure medication.
Objective
The objective of this simulation was to demonstrate how Monte Carlo simulation can be used to evaluate the potential effectiveness of a hypothetical blood pressure medication. The model estimates treatment outcomes by repeatedly simulating virtual patients with random treatment responses and comparing the average blood pressure reduction between a treatment group and a placebo group.
Case Study
A pharmaceutical company has developed a hypothetical medication intended to reduce systolic blood pressure. Before conducting an expensive real-world clinical trial, researchers create a computer simulation to understand how random variation in patient responses may influence the observed treatment effect.
The simulation consists of 200 virtual patients, represented as agents (turtles) in NetLogo. Patients are randomly divided into two equal groups:
- Treatment Group (Green agents): Receives the new medication.
- Placebo Group (Blue agents): Receives an inactive treatment.
Each patient is assigned a randomly generated baseline blood pressure between 120 and 160 mmHg, representing mild to moderate hypertension.
The model assumes that the experimental drug has a 70% probability of producing a therapeutic response. Patients who respond experience a larger reduction in blood pressure, while non-responders experience only a small reduction similar to the placebo group. Patients receiving the placebo also show minor changes due to natural biological variability.
Since every patient’s response is generated randomly, no two simulation runs produce exactly the same outcome. This randomness is the foundation of Monte Carlo simulation.
Model Parameters
| Parameter | Value |
| Sample size | 200 patients |
| Treatment group | 100 patients |
| Placebo group | 100 patients |
| Baseline blood pressure | 120–160 mmHg |
| Drug success rate | 70% |
| Maximum blood pressure reduction | 20 mmHg |
| Number of Monte Carlo repetitions | 100 |
Simulation Procedure
The simulation begins by clicking the Setup button, which creates the virtual patient population and randomly assigns each patient to either the treatment or placebo group. Green agents represent patients receiving the experimental medication, while blue agents represent patients receiving the placebo.
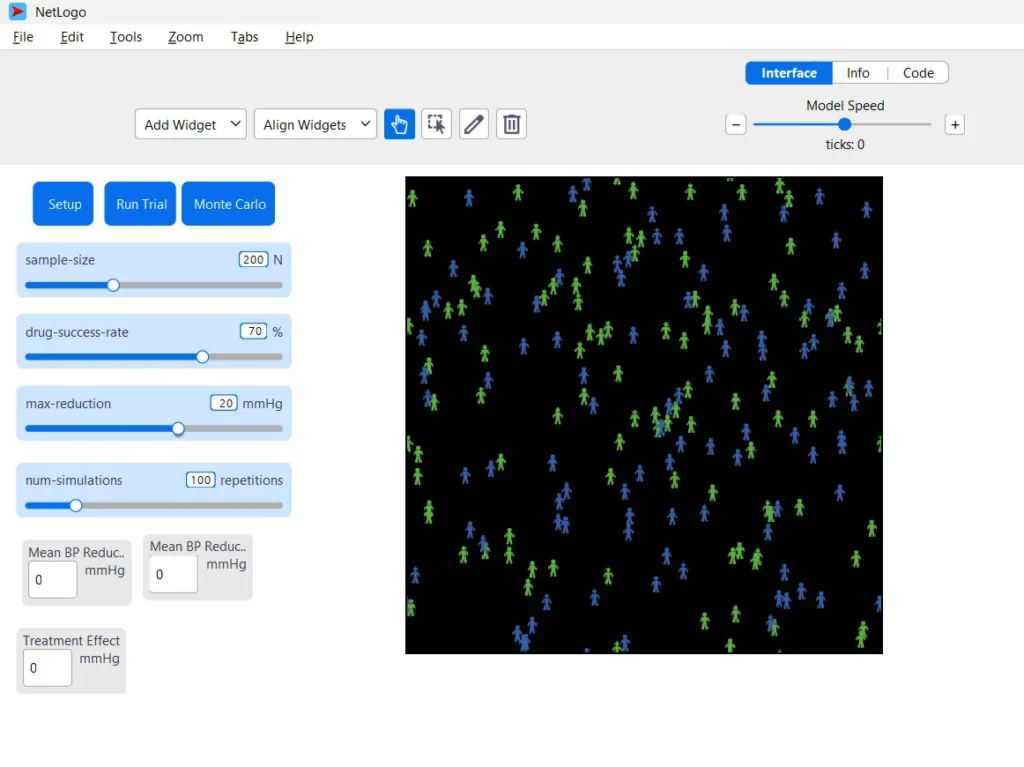
Figure 1. NetLogo interface showing the simulation controls (Setup, Run Trial, Monte Carlo), parameter sliders, and virtual patient population.
Selecting Run Trial performs one simulated clinical trial. During this step, each patient’s blood pressure reduction is calculated according to the assigned treatment and the predefined probability of treatment success. After all patients have been evaluated, the model calculates the mean blood pressure reduction for both groups and determines the treatment effect by subtracting the placebo mean from the treatment mean.
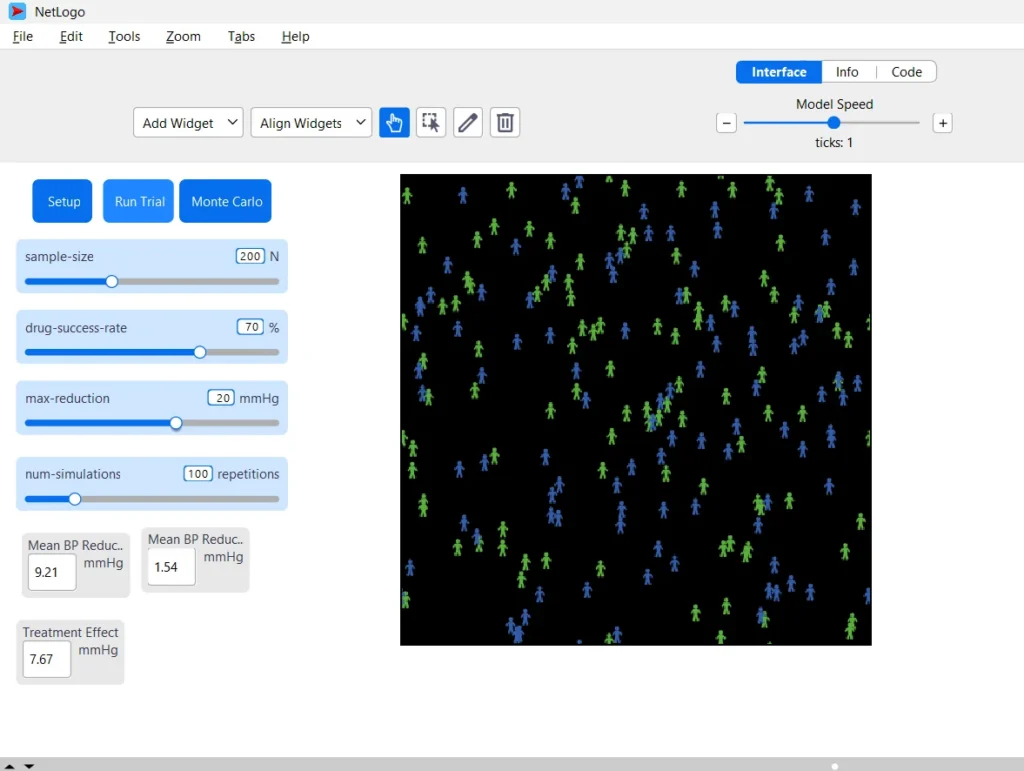
Figure 2. Output after executing Run Trial, displaying the mean blood pressure reduction for the treatment group, placebo group, and the calculated treatment effect.
The Monte Carlo button repeats the experiment multiple times using new random values. Each repetition represents an independent virtual clinical trial, illustrating how random variability influences the observed outcomes across repeated experiments.
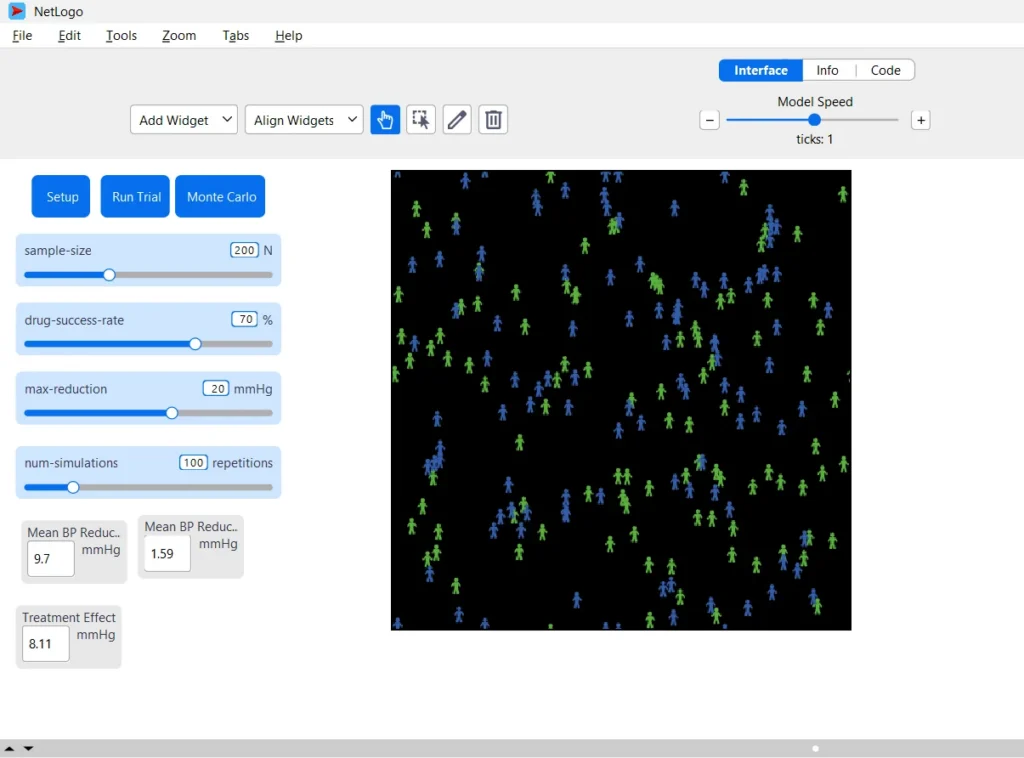
Figure 3. Output after running Monte Carlo illustrating repeated simulations
Results
Results from Run Trial (Primary Results)
| Outcome | Example Result |
| Mean BP Reduction (Treatment) | 9.70 mmHg |
| Mean BP Reduction (Placebo) | 1.59 mmHg |
| Treatment Effect | 8.11 mmHg |
The Run Trial button represents a single simulated clinical trial conducted using 200 virtual patients. For this simulation, the model parameters were set to a sample size of 200 patients, a drug success rate of 70%, a maximum blood pressure reduction of 20 mmHg for responding patients, and a single trial execution. The virtual patients were randomly assigned to either the treatment group (green agents) or the placebo group (blue agents), with each patient’s response generated using random sampling to reflect natural variability.
Under these simulation settings, the treatment group achieved an average systolic blood pressure reduction of 9.70 mmHg, whereas the placebo group showed an average reduction of 1.59 mmHg. The difference between these two groups, referred to as the treatment effect, was 8.11 mmHg.
These findings suggest that, under the specified assumptions, the hypothetical medication produced a substantially greater reduction in blood pressure than the placebo in this simulated clinical trial. The observed treatment effect indicates that the drug performed better than the placebo, demonstrating its potential effectiveness within the predefined simulation conditions.
It is important to note that this result represents only one simulated clinical trial. Because patient responses are generated randomly, the exact values may vary each time the Run Trial button is executed. Similar to real clinical research, biological variability among patients leads to slight differences in outcomes across individual trials. Therefore, the results from a single simulation should be interpreted as one possible scenario rather than conclusive evidence of treatment effectiveness. This limitation highlights the need for repeated simulations using the Monte Carlo procedure to obtain a more robust estimate of the expected treatment effect.
Monte Carlo Results
| Outcome | Example Result |
| Mean BP Reduction (Treatment) | 9.21 mmHg |
| Mean BP Reduction (Placebo) | 1.54 mmHg |
| Treatment Effect | 7.67 mmHg |
The Monte Carlo button repeats the same clinical trial 100 times using the same settings (200 virtual patients, 70% drug success rate, and a maximum blood pressure reduction of 20 mmHg). In each repetition, patient responses are generated randomly, so the results vary slightly from one simulation to another. Across these repeated trials, the treatment group achieved an average blood pressure reduction of 9.21 mmHg, compared with 1.54 mmHg for the placebo group, resulting in an average treatment effect of 7.67 mmHg. This demonstrates that although individual trial results may differ due to randomness, the medication consistently performs better than the placebo, illustrating the value of Monte Carlo simulation in assessing the reliability of results under uncertain conditions.
Educational Value
This model serves as a practical introduction to Monte Carlo simulation and agent-based modeling. It allows students and researchers to explore concepts such as random sampling, probability, treatment response, and repeated experimentation in an interactive environment. By modifying parameters such as sample size, drug success rate, or maximum blood pressure reduction, users can immediately observe how these assumptions influence the simulation outcomes.
Conclusion
The simulation illustrates an important principle of Monte Carlo analysis: outcomes are influenced by random variation. A single simulation provides only one possible result, whereas repeating the experiment many times helps researchers understand the range of likely treatment effects. Although this simplified model does not represent a real clinical trial, it effectively demonstrates how repeated random sampling can be used to evaluate uncertainty and compare treatment performance under controlled assumptions.
Book a free consultation for appointment
Email us at : grow@simbi.in
Note: The parameter values and treatment effects used in this simulation are hypothetical and are intended solely to demonstrate the principles of Monte Carlo simulation in NetLogo. They do not represent data from an actual clinical trial.