
Sampling Techniques in Survey Research: Types, Methods & Examples

Introduction
The quality of survey findings depends heavily on how respondents are selected. A strong statistical model cannot correct a sample that systematically excludes important population groups. Therefore, sampling techniques in survey research should be considered a core part of study design, not simply a way to determine the number of respondents.
In India, sampling becomes especially important for geographically dispersed or diverse populations. The key question is not only how many respondents are needed, but which units should be selected, through what mechanism, and with what probability.
READ THIS ALSO: Methods of GIS in Surveying and Mapping: Techniques, Analysis and Applications
Sampling Frame Determines Who Can Enter the Study
A target population defines who the research findings are intended to represent. A sampling frame is the practical list, database or geographical structure from which those units are selected.
The quality of the frame matters because coverage gaps can exclude eligible participants. For example, a customer database may miss recent customers, while an online panel may underrepresent people with limited internet access.
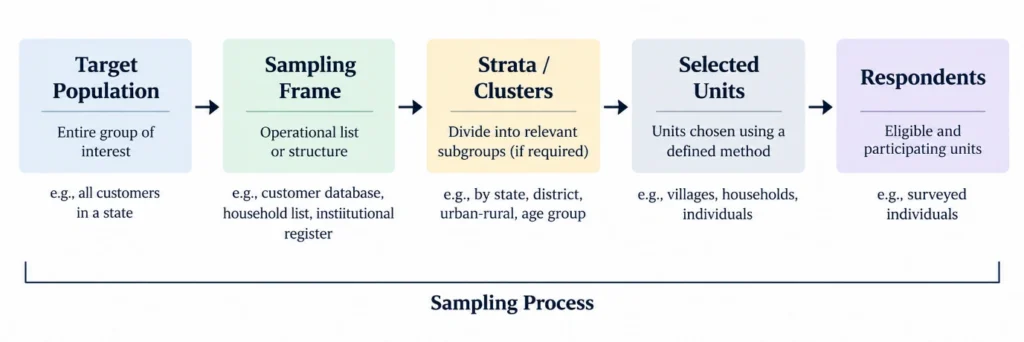
In large Indian surveys, sampling frames can involve villages, urban blocks, households and other administrative or geographical units, often within stratified or multistage designs. This makes frame construction an important part of defensible survey sampling methods.
Probability Sampling: Selection Probabilities Matter
Probability sampling is often described as giving every respondent an equal chance of selection. That description is incomplete.
The defining feature is that selection probabilities are known or can be determined under the sampling design. They do not necessarily have to be equal.
1. Simple Random Sampling
Simple random sampling selects units from a complete frame using a random mechanism. It is statistically straightforward but becomes difficult when the population is geographically dispersed or the frame is incomplete.
2. Systematic Sampling
Systematic sampling selects units at a defined interval after establishing a random starting point. If a frame contains 10,000 customers and the required sample is 1,000, an interval of approximately 10 may be used.
However, researchers should examine the ordering of the frame. Periodicity in the list can create unintended selection patterns.
3. Stratified Sampling
Stratification divides the population into relatively homogeneous subgroups before sampling. Common stratification variables include geography, age, gender, income category, sector and urban-rural location.
Its major methodological advantage is controlled representation. It can also improve precision when units within strata are relatively similar and meaningful differences exist between strata.
4. Cluster and Multistage Sampling
Cluster sampling selects groups rather than immediately selecting individuals. Multistage sampling extends this principle by selecting units through successive stages.
For example:
State → District → Village/Urban Block → Household → Individual
This approach can substantially reduce fieldwork costs. The trade-off is that respondents within the same cluster may be correlated, increasing sampling variance compared with a simple random sample of the same nominal size.
Non-Probability Sampling Requires Careful Generalisation
Non-probability sampling does not provide a known selection probability for every population unit. It is useful in exploratory research, specialised populations and situations where a reliable sampling frame cannot be constructed.
The principal approaches include:
- Convenience sampling: Participants are recruited because they are readily accessible.
- Purposive sampling: Units are deliberately selected because they satisfy specific research characteristics.
- Quota sampling: Recruitment continues until predefined subgroup targets are reached.
- Snowball sampling: Existing participants help identify additional eligible participants.
These are not automatically “bad” methods. Their limitation concerns statistical generalisation. A purposive sample of industry experts may be highly appropriate for an expert-interview study but cannot automatically be interpreted as a probability-based estimate of the entire industry.
Stratification, Clustering and Weighting Change the Analysis
In survey sampling methods, the way respondents are selected can affect how the data should be analysed. If some groups have a higher chance of being selected than others, survey weights can be used to make the results better reflect the target population.
A basic design weight is:
Design Weight = 1 / Selection Probability
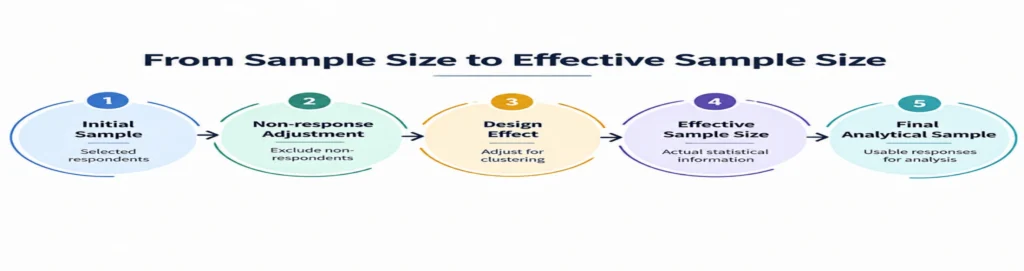
Clustering also matters. Respondents from the same village, school or hospital may have similar characteristics, so 1,000 clustered respondents may provide less statistical information than 1,000 independently selected respondents.
Therefore, complex survey designs may require weighting and adjustments for clustering during statistical analysis.
Sample Size Is About Precision, Not Just Population Size
Sample size depends on more than population size. Researchers should consider:
- Confidence level
- Margin of error
- Expected variability
- Population size
- Design effect
- Expected non-response
- Required subgroup estimates
For simple random sampling, a commonly used formula is:
n = Z²p(1 − p) / e²
Here, Z is the confidence-level value, p is the expected proportion, and e is the margin of error.
In complex surveys, clustering and non-response may require a larger initial sample. Researchers should also distinguish between the selected sample, responding sample and final analytical sample.
A Practical Indian Survey Design
Consider a researcher studying consumer satisfaction across five Indian states. Rather than distributing an online questionnaire until 1,000 responses are obtained, the researcher could first define the target population and establish the available customer frame. The population could then be stratified by state and possibly by urban-rural status.
Within each stratum, respondents could be randomly selected. If fieldwork is conducted geographically, districts or local areas could serve as clusters, followed by household or respondent selection. During fieldwork, the researcher should monitor response rates across strata. If one state has substantially lower participation, the issue should be investigated rather than simply replacing missing respondents with easily accessible participants.
If the final design produces unequal selection probabilities, the analysis should account for them through appropriate weighting. The resulting survey is therefore not merely a collection of 1,000 responses; it is a designed sample with an identifiable relationship to the target population.
Non-Response Can Create Bias After Sampling
Even a carefully constructed probability sample can become biased when selected respondents systematically fail to participate.
This creates an important distinction between sampling error and non-response error. Increasing the number of respondents does not necessarily eliminate non-response bias if the additional respondents come disproportionately from groups that are already easy to reach.
Researchers should therefore monitor:
- Response rate by subgroup or geographical area.
- Differences between early and late respondents.
- Reasons for refusal or non-contact.
- Replacement procedures.
- Whether weighting adjustments are required.
The goal is not merely to maximise the response count but to understand whether the achieved sample remains appropriate for the intended inference.
Survey Sampling Techniques Need Fieldwork Controls
A technically correct sampling plan can still fail during implementation. Respondent substitution, interviewer convenience, duplicate records and incomplete coverage can change the achieved sample.
Digital collection platforms can strengthen these controls when they are integrated with the sampling protocol. For example, KoboToolbox supports web-based and mobile data collection, including offline fieldwork, while its validation functions allow teams to review and classify submitted records.
However, technology does not replace sampling methodology. A mobile application can improve data capture, but it cannot make a convenience sample statistically equivalent to a probability sample.
Matching Sampling Design to Research Objectives
The appropriate sampling techniques for surveys depend on what the researcher intends to estimate.
For population-level estimates, probability designs are generally preferable because selection probabilities can be incorporated into statistical estimation. For exploratory studies involving specialised participants, purposive approaches may be more appropriate.
The important decision points include:
| Research requirement | Sampling consideration |
| Population estimate | Probability-based design |
| Important subgroup comparisons | Stratified sampling |
| Geographically dispersed population | Cluster or multistage design |
| Complete respondent list available | Simple random/systematic sampling |
| Rare or difficult-to-reach population | Purposive or snowball approach |
| Unequal selection probabilities | Weighting during estimation |
| High cluster similarity | Account for design effect |
| High expected non-response | Oversampling and non-response monitoring |
Building a Defensible Sampling Protocol
A professional sampling protocol should document more than the selected method. It should explain why that method was appropriate and how it was implemented.
At minimum, document the target population, sampling unit, sampling frame, inclusion criteria, selection mechanism, sample allocation, expected non-response, replacement rules and weighting requirements.
For probability surveys, researchers should also retain the information needed to reconstruct selection probabilities. This makes the final dataset more transparent and strengthens the methodological justification of the study.
These details become especially important in dissertations, journal manuscripts and commissioned research where reviewers may question whether the achieved sample supports the stated conclusions.
Conclusion
Effective sampling techniques in survey research are fundamentally about connecting a research population with a defensible selection and estimation process. Simple random, systematic, stratified, cluster and multistage designs each solve different sampling problems, while non-probability approaches have specific uses when probability-based selection is impractical.
The deeper issue is not simply choosing between survey sampling techniques. Researchers need to consider the sampling frame, selection probabilities, clustering, weighting, non-response, effective sample size and the level of generalisation that the study can legitimately support.
For Indian surveys, particularly those covering multiple geographical or demographic groups, careful sampling design can make the difference between a dataset that merely contains many responses and one that provides defensible evidence about the population being studied.
Need Professional Sampling and Data Collection Support?
A reliable survey requires more than a questionnaire and a target number of respondents. Sampling design, sample-size planning, respondent selection, fieldwork monitoring, data validation and statistical analysis need to work together.
Simbi Labs provides professional support for survey sampling, data collection, questionnaire development, statistical analysis and research projects in India.
Build a scientifically defensible survey from the beginning.
Book a Free Consultation and discuss your research requirements with the Simbi Labs team.
Frequently Asked Questions
1. What are the main sampling techniques in survey research?
The main probability-based techniques include simple random, systematic, stratified, cluster and multistage sampling. Non-probability approaches include convenience, purposive, quota and snowball sampling.
2. What is the difference between probability and non-probability sampling?
Probability sampling uses a defined selection mechanism in which the selection probability of population units can be determined. Non-probability sampling does not provide a known selection probability for every unit, so researchers need to be more cautious when generalising findings to the wider population.
3. Which sampling method is suitable for large surveys in India?
Large and geographically dispersed surveys may use stratified, cluster or multistage sampling because these designs can organise fieldwork across different geographical and population units. The appropriate design depends on the available sampling frame, research objective, population structure and required precision.
4. Does a larger sample always produce more accurate survey results?
No. Sample size alone does not guarantee representativeness. Coverage problems, non-response, poor selection procedures and clustering can affect the quality of estimates even when the number of respondents is large.
5. When should researchers use stratified sampling?
Stratified sampling is useful when the population contains identifiable subgroups that need controlled representation, such as states, regions, age groups, sectors or urban-rural categories. Sampling separately within these groups can improve representation and, under suitable conditions, statistical precision.
6. What should be documented in a survey sampling method?
Researchers should document the target population, sampling unit, sampling frame, sampling technique, sample-size calculation, selection procedure, sample allocation, non-response handling and any weighting or adjustment procedures used during analysis.