
How Technology Is Transforming Crowd Management and Public Safety
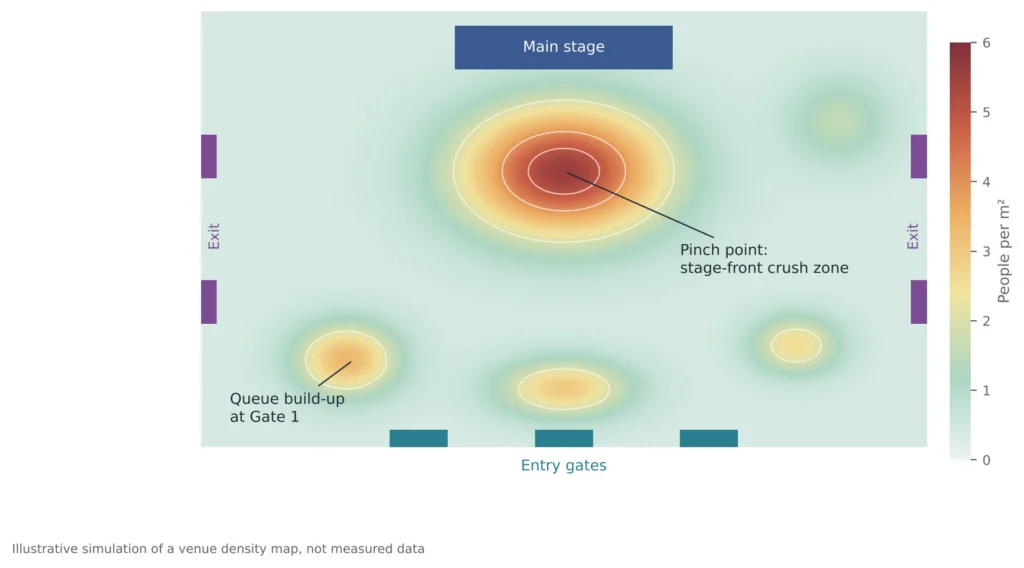
Figure 1: A simulated venue density map showing how pressure builds at gates and in front of the stage
The first warning of a crowd crush rarely comes from the crowd. It comes from the numbers: a gate that admits people faster than the concourse can clear them, a corridor whose width no longer matches the flow, an exit that thousands of people are quietly heading towards at once. All of this can be measured and mapped before anyone is in danger.
That is the shift now underway in crowd management. Festivals, stadium fixtures, religious gatherings, political rallies and busy transport hubs are moving from experience-led stewarding to data-led crowd management, where sensors, spatial analysis and live dashboards give control rooms minutes of warning instead of seconds. A recent systematic review of GIS-based crowd management organises this field around four capabilities: spatial risk assessment, crowd flow analysis, real-time monitoring and emergency evacuation . This guide explains each one, shows how the pieces fit into a working crowd management system, and ends with a readiness checklist you can use on your next event.
Why Crowd Safety Needs Spatial Data
Crowd incidents rarely begin with one dramatic failure. They build through small, connected problems: a narrow entry, a blocked exit, a sudden surge towards a performer, a delay that makes people bunch up. Each is a spatial problem. It happens at a particular place, at a particular density, with a particular number of people trying to move through a particular width.
Density is the clearest single indicator. Pedestrian planning has long used the Level of Service scale introduced by John Fruin, which grades space per person from free flow (LOS A) to jammed conditions (LOS F) . Empirical analysis of the 2006 Jamarat crowd disaster by Helbing and colleagues found that as densities reached roughly five to six people per square metre or more, crowd flow turned turbulent and people were pushed involuntarily . At that point individual stewards can do very little. The only effective intervention is the one made earlier.
READ MORE: Crowd Safety Audit
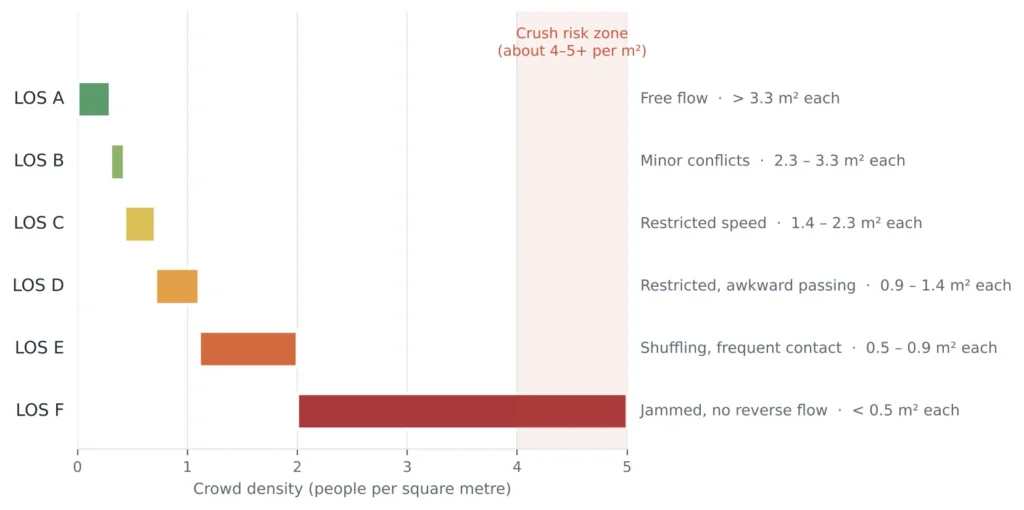
Figure 2: Level of Service bands (after Fruin) mapped to crowd density; the shaded zone marks conditions where crush risk rises sharply
This is why crowd monitoring technology matters. It does not replace safe design or trained staff. It tells them where density is rising and how fast, so they can act while a proportionate response is still possible.
What Is GIS-Based Crowd Management?
A geographic information system (GIS) stores and analyses information by location. Applied to crowds, it places every relevant fact on a common map: the venue layout, zone capacities, gates and exits, live counts, historical patterns and hazards. Once information shares a map, questions that used to need guesswork become answerable. Where will the queue from Gate 3 spill over? Which exit is overloaded in an evacuation? Which zone breaches its limit first if attendance runs 15 percent above plan?
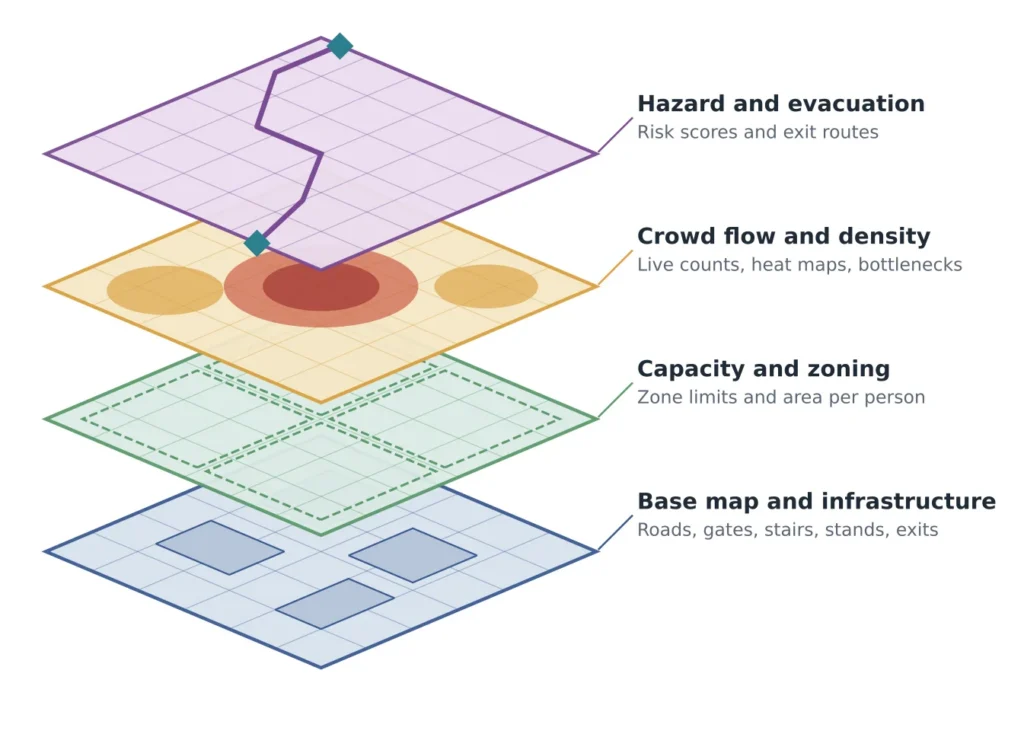
Figure 3: GIS organises crowd information as stacked map layers that can be analysed together
The systematic review mentioned above structures the literature around four themes, and they make a practical framework for any organiser :
- Spatial risk assessment: identifying where and why risk concentrates, before the event.
- Crowd flow analysis: modelling how people move through gates, corridors and open areas.
- Real-time monitoring: measuring density and movement as the event unfolds.
- Emergency evacuation: planning, testing and directing exit routes under stress.
To explore this topic further, please follow this link: GIS-Based Crowd Management at Large-Scale Gatherings: A Systematic Review of Spatial Risk Assessment, Crowd Flow Analysis, Real-Time Monitoring and Emergency Evacuation
How a Crowd Management System Works
A crowd management system combines hardware, software and procedures that monitor people in a defined space and support decisions on access, movement and emergency response. Whatever the vendor or venue, the architecture follows four layers.
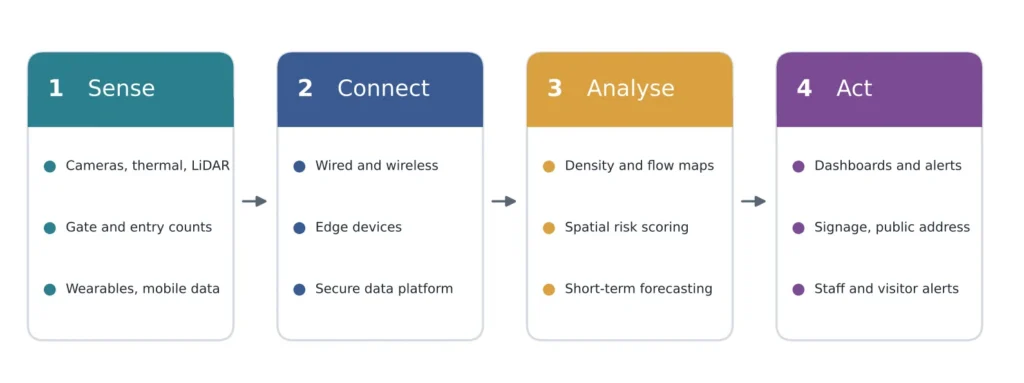
Figure 4: The four layers of a crowd management system, from sensing to action
- Sense: cameras, thermal and LiDAR sensors, turnstile and ticket counters, wearables and anonymised mobile-signal data capture raw information.
- Connect: wired and wireless networks, edge devices and a secure platform bring the data to one place with low delay.
- Analyse: software converts feeds into counts, density maps, flow rates and short-term forecasts, and compares them with the thresholds set at planning stage.
- Act: dashboards, alerts, signage, public-address systems and staff messaging turn analysis into a response.
The weakest layer decides the system’s value. A venue with excellent cameras but no agreed thresholds, or accurate alerts but no one authorised to act on them, has monitoring without management.
Spatial Risk Assessment: Finding Problems Before the Gates Open
Risk assessment is where the largest safety gains are made, because it is the only stage at which layout can still be changed cheaply. A spatial assessment typically works through four steps.
- Map the site. Digitise the venue: usable area per zone, gate and exit widths, stairs, slopes, barriers, vendor stalls and temporary structures.
- Estimate demand. Combine expected attendance, arrival profile, ticket scanning rates and approach routes into a realistic load on each entry point.
- Compute capacity. Divide usable area by a target area per person to set a limit for each zone, with separate limits for standing areas, queues and circulation routes.
- Score and rank risk. Combine density, bottleneck severity, exit availability and incident history into a risk score for every zone, then fix the highest-scoring locations first.
| Risk factor | What to map | Typical mitigation |
| Entry bottleneck | Gate width, scan rate, queue storage area | Add lanes, stagger entry times, extend queue area |
| Stage-front density | Area in front of stage, barrier layout, sight lines | Pens or zones, capacity cap, additional exits |
| Counter-flow | Where entering and exiting streams cross | One-way routes, physical separation |
| Level changes | Stairs, ramps, underpasses and their widths | Stewarding, flow metering, alternative routes |
| Exit shortfall | Exit width against zone capacity | Widen or add exits, restrict zone numbers |
Crowd Flow Analysis: Understanding How People Actually Move
Capacity alone does not describe safety. Two venues with the same area and the same attendance can behave very differently depending on how people enter, circulate and leave. Flow analysis adds movement to the picture.
The basic relationship is simple: flow equals density multiplied by walking speed multiplied by the width of the route. As density rises, speed falls, and past a certain point total flow through a corridor or gate actually declines. This is why a doubling of the crowd at a bottleneck can lengthen waits by far more than double, and why queue management at entrances is a safety function, not only a convenience.
Planners use three families of method:
- Network analysis on the venue’s route graph, to find shortest paths, route overlaps and the links most likely to saturate.
- Microscopic simulation, including agent-based models, in which each simulated person has a speed, destination and reaction to neighbours. Run before an event, these show how layouts and entry rules perform under different attendance scenarios.
- Digital twins, in which a calibrated model is fed live counts so that planners can ask what happens in the next 10 to 30 minutes if conditions continue.
All three depend on good input data: measured gate throughput, observed walking speeds and real arrival patterns from comparable events. Models built on assumptions alone give confident answers to the wrong questions. This is where structured field data collection earns its place in a safety programme.
Real-Time Monitoring: Turning Live Data into Early Warning
Real-time monitoring closes the gap between plan and reality. No attendance forecast is perfect, and crowds respond to weather, delays, announcements and rumours. Live data tells the control room which version of the plan is actually unfolding.
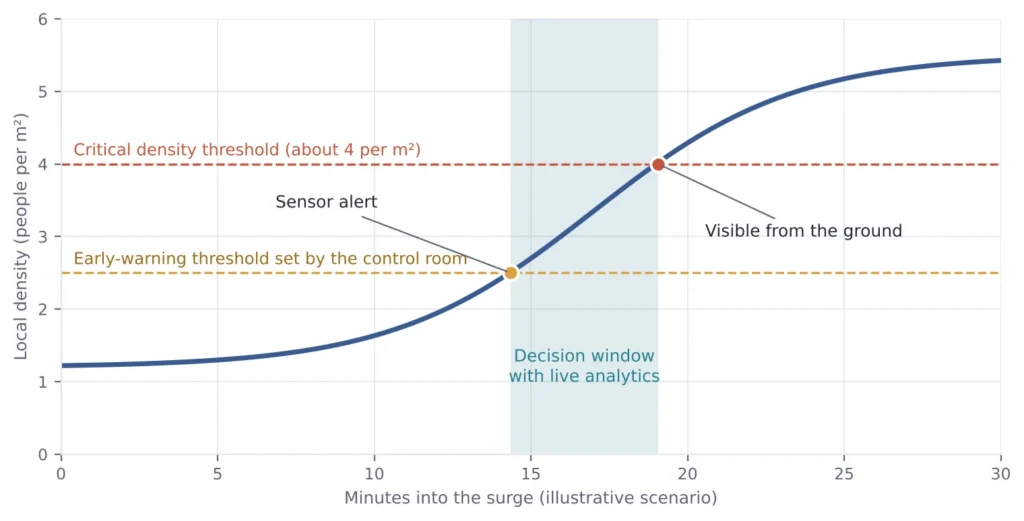
Figure 5: Illustrative scenario showing the decision window that live density monitoring can create before conditions become visible from the ground
The figure is a conceptual illustration, not measured data, but the principle is general. An alert set below the critical threshold converts a sudden emergency into a manageable operational decision: pause entry, open another route, redeploy staff, make an announcement. Most venues combine several sensing methods, because each has different strengths.
| Technology | What it measures | Best used for | Key consideration |
| Video analytics | Counts, density, flow, unusual movement | Venues with existing CCTV | Needs calibration and good lighting |
| Thermal and LiDAR sensors | Presence and movement without faces | Dense areas, night events | Hardware cost and coverage planning |
| Entry and exit counters | Total occupancy | Capacity control at gates | Counts the whole site, not hot spots |
| Wi-Fi, Bluetooth and mobile data | Aggregated movement and dwell times | Large or open areas, planning | Limited fine-scale accuracy; consent rules |
| Wearables and RFID | Staff and participant location | Controlled and ticketed events | Requires participant uptake |
| Drones | Aerial view of congestion | Open sites, approach roads | Aviation rules and weather |
| Simulation models | Predicted flow and evacuation time | Pre-event design and testing | Quality depends on input data |
Two design principles help. First, always compare a whole-site occupancy count with a zone-level view: total attendance can be well below capacity while one zone is dangerously full. Second, agree thresholds and responsible decision-makers in writing before the event. An alert that nobody is authorised to act on is just noise.
Emergency Evacuation: Planning for the Day Everything Goes Wrong
Evacuation planning is where spatial analysis is most valuable and most often neglected. The question is not whether a venue has enough exits on paper, but whether people can reach them in time under realistic conditions.
- Exit assignment: assign each zone to primary and alternative exits so that no single exit receives more people than its width can clear.
- Evacuation time estimates: combine travel time to the exit with the time needed to pass through it. The slower of the two usually decides total clearance time, and it is commonly the exit, not the distance.
- Dynamic guidance: if an exit or route is blocked, digital signage, public address and staff messaging should redirect people to alternatives using current density, not the static plan.
- Emergency access: keep ambulance and fire routes separate from crowd routes, and map them on the same layers as the crowd plan.
- Rehearsal: test the plan with staff drills and simulation, and update the model with the lessons.
Role of AI and Predictive Analytics
Artificial intelligence strengthens crowd management technology by recognising patterns faster than any operator watching many screens. Models can estimate density from video, flag abnormal behaviour such as sudden running or a stationary build-up at a gate, and forecast where crowding is likely in the next ten to thirty minutes. Combined with historical data from earlier events, they can help predict peak arrival times and queue lengths.
AI is decision support, not a replacement for trained staff. Systems produce false alarms and miss events, and performance varies with camera angle, lighting and crowd size. Every alert should lead to a verified human decision, and every deployment should be tested at the actual site.
Public Safety Beyond Events
The same tools protect people in everyday settings. Railway stations and airports use counting and flow analytics to manage peak hours. Cities monitor busy markets, religious sites and public squares, and emergency services use density data to plan access and evacuation routes. During disasters or health emergencies, aggregated movement data helps authorities direct people and resources.
Privacy, Ethics and Compliance
Monitoring people raises legitimate concerns, and public trust depends on how data is used. Responsible deployments follow clear principles:
- Purpose limitation. Collect data only for safety and operations, and say so plainly.
- Data minimisation. Prefer counts and density over identification wherever possible.
- Anonymisation and retention limits. Aggregate data and delete raw footage on a defined schedule.
- Transparency. Display notices that explain monitoring at the venue.
- Legal compliance. Follow applicable laws such as India’s Digital Personal Data Protection Act, 2023, and GDPR where relevant, along with local venue and safety regulations.
- Fairness and oversight. Test systems for accuracy across conditions and keep humans accountable for decisions.
Is Your Venue Ready? A 10-Point Crowd Safety Data Check
Use this checklist to see where your current plan relies on assumptions rather than evidence. If you cannot answer yes to three or more items, a data-led review is likely to pay for itself.
| No. | Question | Why it matters |
| 1 | Do you have a digital, measured map of the site? | Capacity and flow cannot be analysed without it |
| 2 | Is there a capacity limit for every zone, not only the whole venue? | Hot spots fill long before the total is reached |
| 3 | Have you measured gate throughput, not assumed it? | Entry rate drives queue size and surge risk |
| 4 | Have you modelled attendance above the forecast? | Real crowds exceed plans |
| 5 | Is every exit matched to the zones it serves? | Prevents one exit being overloaded |
| 6 | Do you have live density data for critical zones? | Gives time to act before conditions are visible |
| 7 | Are alert thresholds and decision-makers agreed in writing? | Turns data into action |
| 8 | Has the evacuation plan been tested by drill or simulation? | Paper plans often fail in practice |
| 9 | Is there a data protection and retention policy for monitoring? | Protects attendees and the organiser |
| 10 | Do you review data after each event to improve the next plan? | Builds a measured evidence base over time |
Table 3: Crowd safety data readiness checklist
How to Choose and Implement Crowd Management Systems
- Start with risk. Identify bottlenecks, maximum capacity and worst-case scenarios.
- Define outcomes. Decide which decisions the data must support, such as pausing entry or opening an exit.
- Match tools to the site. Indoor stadiums, open grounds and transport hubs need different sensor mixes.
- Check integration. Systems should work with ticketing, access control, communication and emergency tools.
- Pilot and calibrate. Test at a smaller event before relying on the system at scale.
- Train and rehearse. Run drills so staff know exactly how to act on alerts.
- Plan for resilience. Include backup power, network redundancy and manual procedures for system failure.
How Simbi Labs Supports Crowd Safety Planning
Crowd safety decisions are only as good as the data behind them. The Research and Analytics Division at Simbi Labs supports organisations that need structured data collection, spatial analysis and clear reporting for planning and evaluation. We work with event organisers, venue operators, transport and civic bodies, and academic and research teams.
- Field data collection: surveys, counts and observation studies, online and offline, including gate throughput and movement observation.
- GIS and spatial analysis: mapping sites, routes and congestion points, with zone capacity and exit analysis.
- Statistical analysis and reporting: SPSS, R, Stata and Excel, with findings presented in plain language.
- Dashboards and visual reporting: clear views for operations teams and decision-makers.
Whether you are designing a new event, reviewing a venue or building the evidence for a public-space project, we can help you move from assumptions to measured, mapped evidence.
Conclusion
Technology is changing crowd management from reaction to prevention. Spatial risk assessment shows where problems will form, flow analysis shows how people will move, real-time monitoring shows what is actually happening, and evacuation modelling shows whether people can leave in time. Used together, with trained staff, clear communication and respect for privacy, they give organisers an objective picture of how people occupy a space and the earlier warning needed to act. Safer crowds start with better information.
Ready to plan with better information?
For expert support with data collection, spatial analysis and reporting, connect with Simbi Labs, the Research and Analytics Division of Simbi Labs India.
Book a free consultation: app.simbilabs.com/appointment
Email: grow@simbi.in | Call: +91-99505-66669
Frequently Asked Questions
1. What is crowd management technology?
Crowd management technology is the set of sensors, software and communication tools used to monitor crowds, measure density and movement, and support safe decisions about access, routing and emergency response.
2. How do crowd management systems work?
They collect data from cameras, sensors and counters, combine it on a platform, analyse it for density and flow, and send alerts and dashboards to operators so they can act early.
3. What is GIS-based crowd management?
It uses geographic information systems to place venue layouts, capacities, live counts and hazards on one map, so that risk, flow and evacuation can be analysed spatially .
4. What is crowd safety technology used for?
It is used to prevent overcrowding, detect dangerous build-ups, guide evacuations, locate staff and incidents, and communicate with visitors during an event or emergency.
5. What does event crowd management involve?
It involves pre-event planning and modelling, setting capacity limits, live monitoring during the event, clear communication with attendees, and reviewing data afterwards to improve future events.
6. Which crowd monitoring technology is most accurate?
No single tool is best everywhere. Entry counters give reliable total occupancy, while video analytics, thermal sensors and LiDAR show where crowds are building. Most venues combine several.
7. What crowd density is dangerous?
Risk rises steeply as density approaches four to five people per square metre, and flow can turn turbulent at higher levels . Safe planning targets keep working densities well below this.
8. Does crowd monitoring affect privacy?
It can, so deployments should minimise personal data, prefer anonymised counts, set retention limits, inform visitors and comply with applicable data protection laws.
9. Can AI predict crowd surges?
AI can estimate density and forecast likely crowding over a short horizon using live and historical data. It supports operators, but its predictions must be checked and acted on by trained staff.
10. Can Simbi Labs help with data collection and analysis for events?
Yes. Simbi Labs supports field data collection, GIS mapping, statistical analysis and reporting for research and planning projects.