
Troubleshooting the Most Common Production Line Failures : A Lean Six Sigma Approach

Introduction
In every manufacturing facility, smooth production lines are essential for delivering products on time, within budget, and at the expected quality. Yet, breakdowns and bottlenecks remain frequent challenges. These failures—if not properly addressed – lead to missed deadlines, increased waste, and customer dissatisfaction. Troubleshooting Production Line Failures Lean Six Sigma offers a structured and data-driven approach to not just identify issues but also eliminate their root causes permanently. By leveraging proven methodologies such as DMAIC (Define, Measure, Analyze, Improve, Control), organizations can systematically analyze inefficiencies, reduce variability, and enhance overall process performance. This approach ensures that production disruptions are minimized, operational efficiency is improved, and consistent quality standards are maintained across the manufacturing process.
Common Production Line Failures
Here are some of the most frequent failures seen in Indian manufacturing plants and beyond:
1. Machine Downtime
– Due to mechanical failure, poor maintenance, or inconsistent operating conditions.
2. Quality Defects
– Caused by process variation, incorrect settings, or human error.
3. Material Shortages
– Poor inventory control or delayed procurement.
4. Bottlenecks
– Workflow imbalances where one step is slower than others.
5. Operator Errors
– Inadequate training, unclear work instructions, or fatigue.
6. Overproduction
– Producing more than needed, leading to storage issues and excess cost.
Troubleshooting Approach Using Lean Six Sigma
To resolve these failures, Lean Six Sigma combines data analysis with process improvement tools. The DMAIC (Define, Measure, Analyze, Improve, Control) method offers a systematic framework. For more on applying Lean Six Sigma tools, refer to our article on Lean Six Sigma Manufacturing Challenges and Solutions.
1. Define the Problem
i. Identify the type and impact of failure.
ii. Use SIPOC diagrams and Voice of the Customer (VOC) to clarify scope.
2. Measure the Process
i. Collect performance data like defect rates, downtime minutes, and cycle time.
ii. Tools used:
Pareto Charts – Rank issues by frequency or cost.
Time Studies – Measure where delays or stoppages happen.
3. Analyze Root Causes
i. Identify why the problem is happening repeatedly.
ii. Tools used:
Fishbone Diagram – Categorize causes (machine, method, manpower, material).
Whys – Drill down to the core issue.
ANOVA – Compare failure rates across shifts, machines, or materials.
Regression Analysis – Examine correlation between input factors and output quality.
4. Improve the Process
i. Test and implement permanent fixes.
ii. Actions may include:
Standardized Work Instructions (SOPs)
Poka-Yoke (mistake-proofing devices)
DoE (Design of Experiments) – To find optimal process settings.
Kanban – To prevent overproduction and material shortage.
5. Control and Sustain Improvements
Keep processes under control with:
i. SPC Charts (Statistical Process Control)
ii. Control Plans
iii. Daily checklists and audits
iv. Preventive Maintenance Schedules
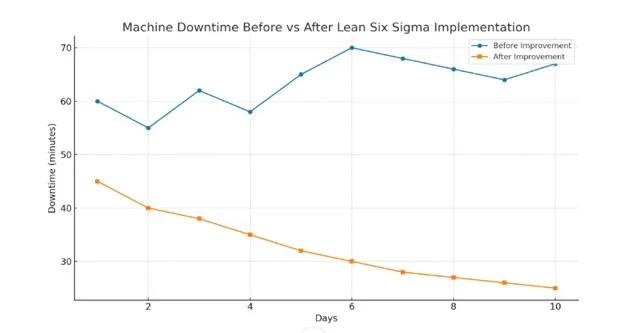
Example: Reducing Machine Downtime on the Assembly Line
Problem:
A bottling plant faced recurring machine downtime, averaging 65 minutes/day, affecting production output and delivery timelines.
Implementation Steps:
1. Define:
Used SIPOC and VOC to identify the frequent stoppage of the capping machine.
2. Measure:
Recorded downtime over 10 days using a Pareto chart and Control Chart.
3. Analyze:
Used Fishbone and 5 Whys – root cause was improper lubrication scheduling.
4. Improve:
Introduced preventive maintenance SOP, trained staff, and scheduled auto-lubrication.
5. Control:
Monitored downtime using SPC charts and enforced a daily equipment checklist.
Some Lean Six Sigma terms:
| Term | Definition |
| SIPOC | Diagram showing Suppliers, Inputs, Process, Outputs, Customers |
| Poka-Yoke | Mistake-proofing method |
| DoE | Design of Experiments – testing variables for optimization |
| OEE | Overall Equipment Effectiveness |
| Control Chart | Monitors process variation over time |
| VOC | Voice of the Customer |
| 5 Whys | Technique for root cause analysis |
| RPN | Risk Priority Number used in FMEA |
Statistical Techniques You Can Use
| Technique | Purpose |
| Pareto Analysis | Identify top causes of failure |
| Control Charts (SPC) | Monitor process stability over time |
| MSA (Gage R&R) | Confirm measurement system accuracy |
| ANOVA | Compare multiple factors (shifts, machines, etc.) |
| Regression Analysis | Predict impact of variables on process output |
| Histogram | View data spread and spot abnormal clusters |
| Scatter Plot | Analyze relationships between two variables |
| DoE | Test process improvements across several variables |
Use of Real-Time Monitoring Tools
Adding digital tools enhances proactive troubleshooting:
1. IoT Sensors monitor temperature, vibration, or machine runtime.
2. Digital Dashboards display live KPIs like downtime, quality, and cycle time.
3. SCADA Systems provide data acquisition and control in real time.
4. Predictive Maintenance Algorithms flag anomalies before failure occurs.
Other Things to Include in Troubleshooting
1. Operator Feedback: Often the best insights come from those on the line.
2. Maintenance Logs: Review breakdown trends and history.
3. Training Records: Identify knowledge gaps among operators.
4. Root Cause Tracker: Maintain a record of recurring problems and actions taken.
5. Digital Dashboards: Use visual KPIs to detect real-time issues.
Read Also : How to Identify and Resolve Recurring Manufacturing Issues
Conclusion
Production line failures are inevitable—but they don’t have to be permanent. With Lean Six Sigma tools and statistical techniques, manufacturers can shift from reactive firefighting to proactive prevention. By identifying root causes, involving your team, and applying data-driven solutions, you not only fix the problem—you build a process that resists it in the future.
Book a free consultation for appointment
Email us at : grow@simbi.in
Explore our Lean Six Sigma Consulting Services to see how our expert-led approach, proven tools, and industry know-how enable organizations to optimize processes and elevate operational performance.